 3
3peptides
spectra
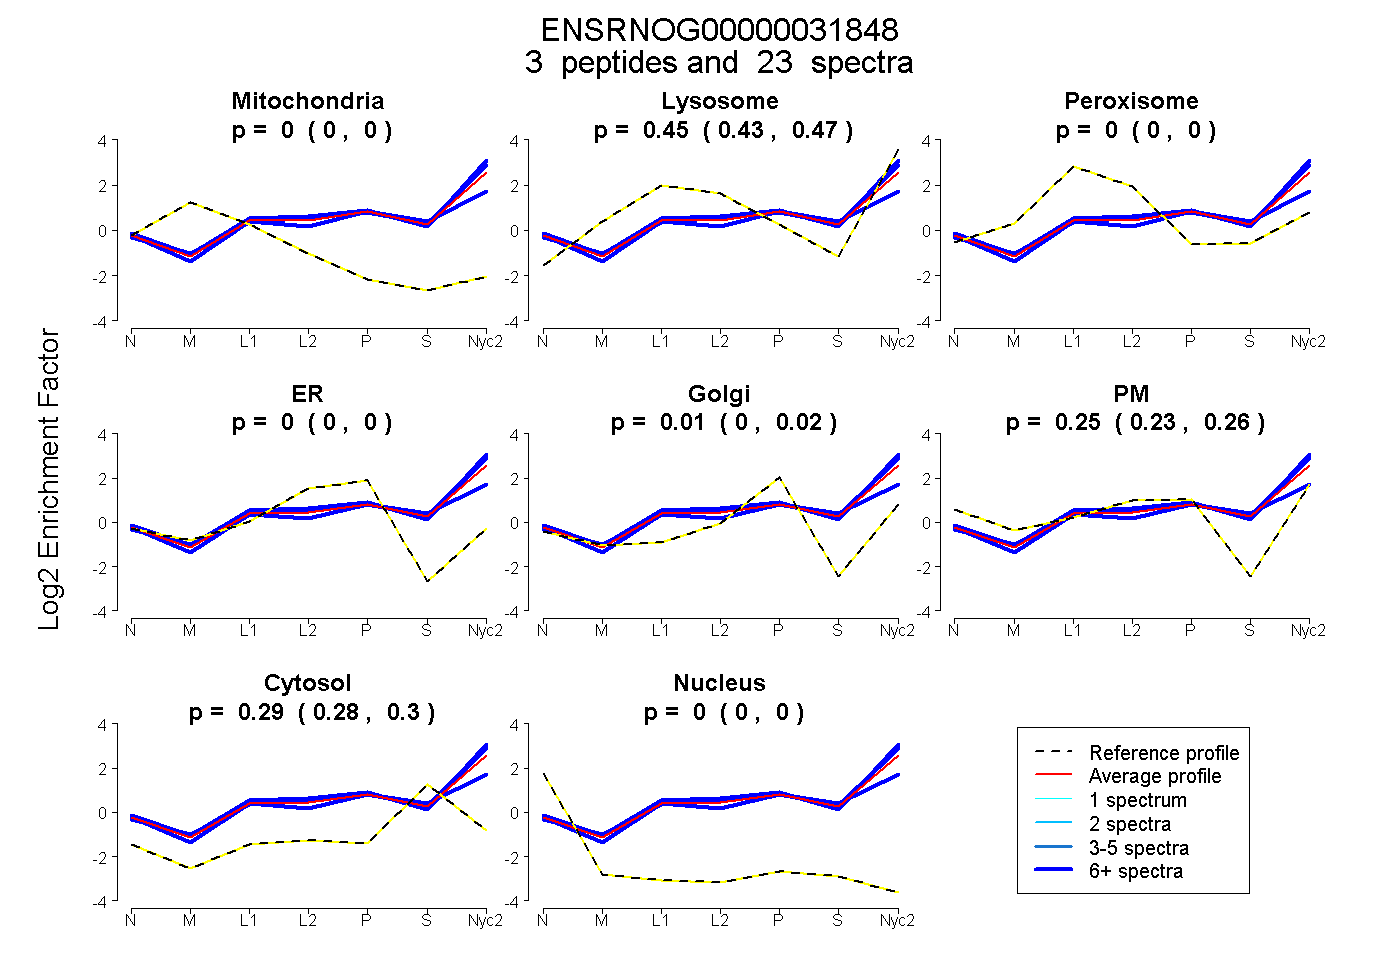
0.000 | 0.000
0.428 | 0.471
0.000 | 0.000
0.000 | 0.000
0.000 | 0.022
0.225 | 0.261
0.280 | 0.301
0.000 | 0.000
1peptide
spectrum
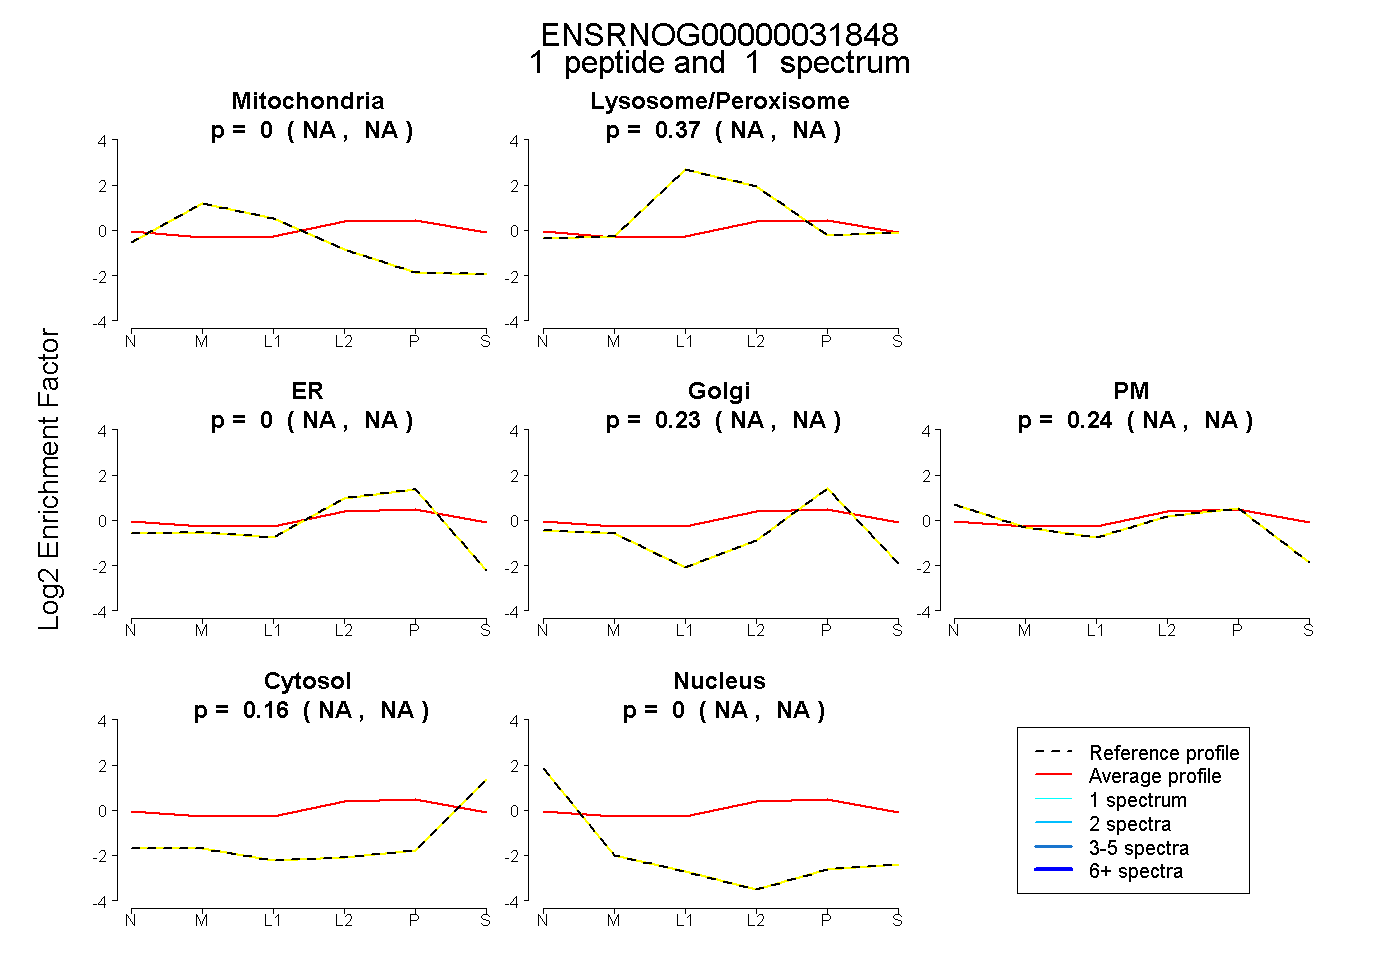
NA | NA
NA | NA
NA | NA
NA | NA
NA | NA
NA | NA
NA | NA
1peptide
spectra
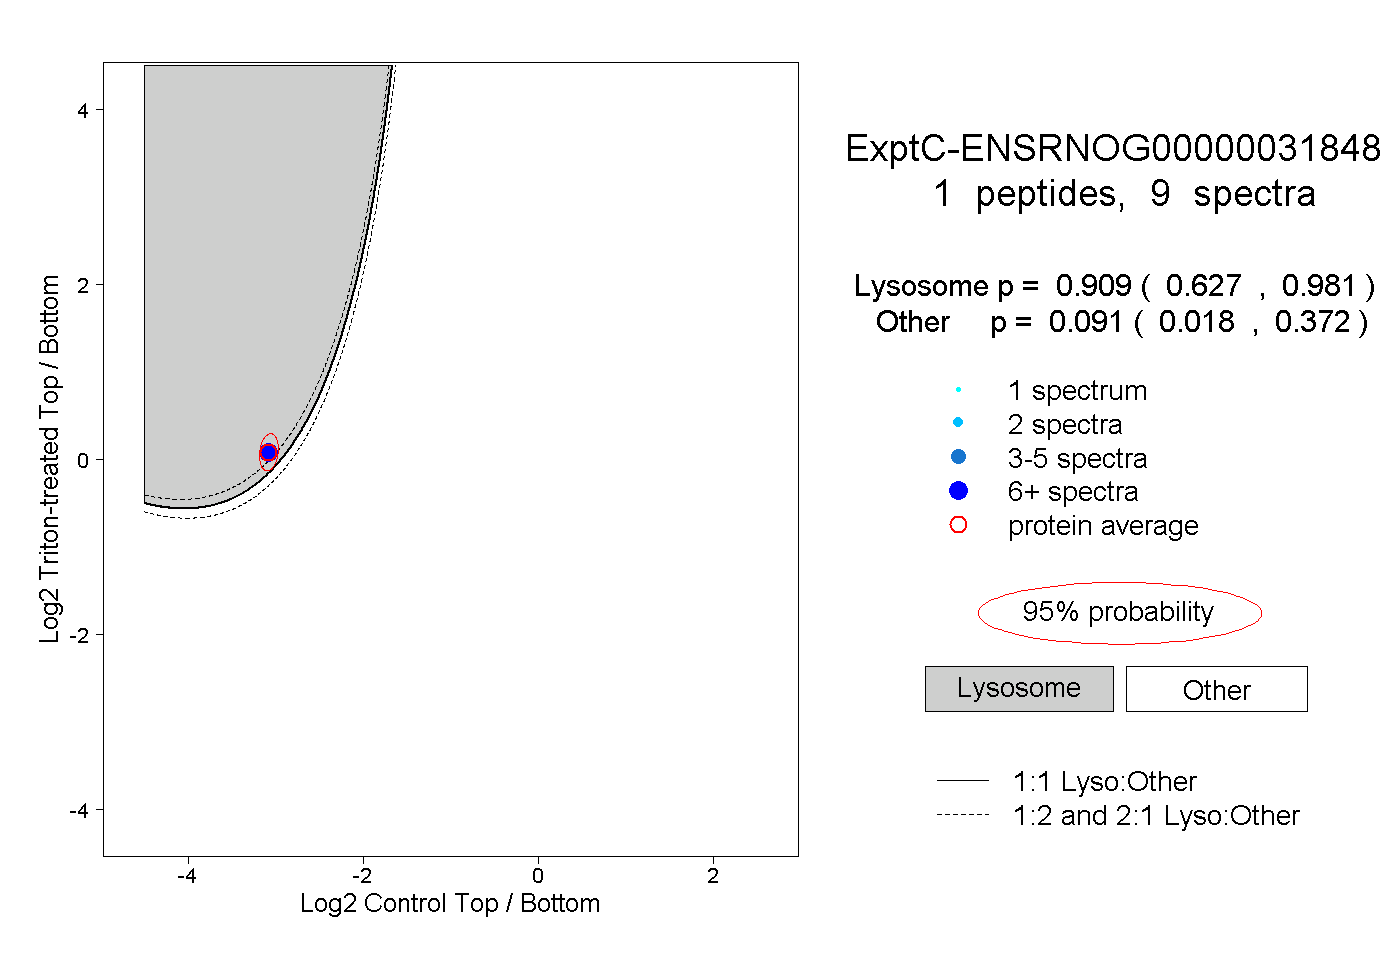
0.627 | 0.981
0.018 | 0.372