 3
3peptides
spectra
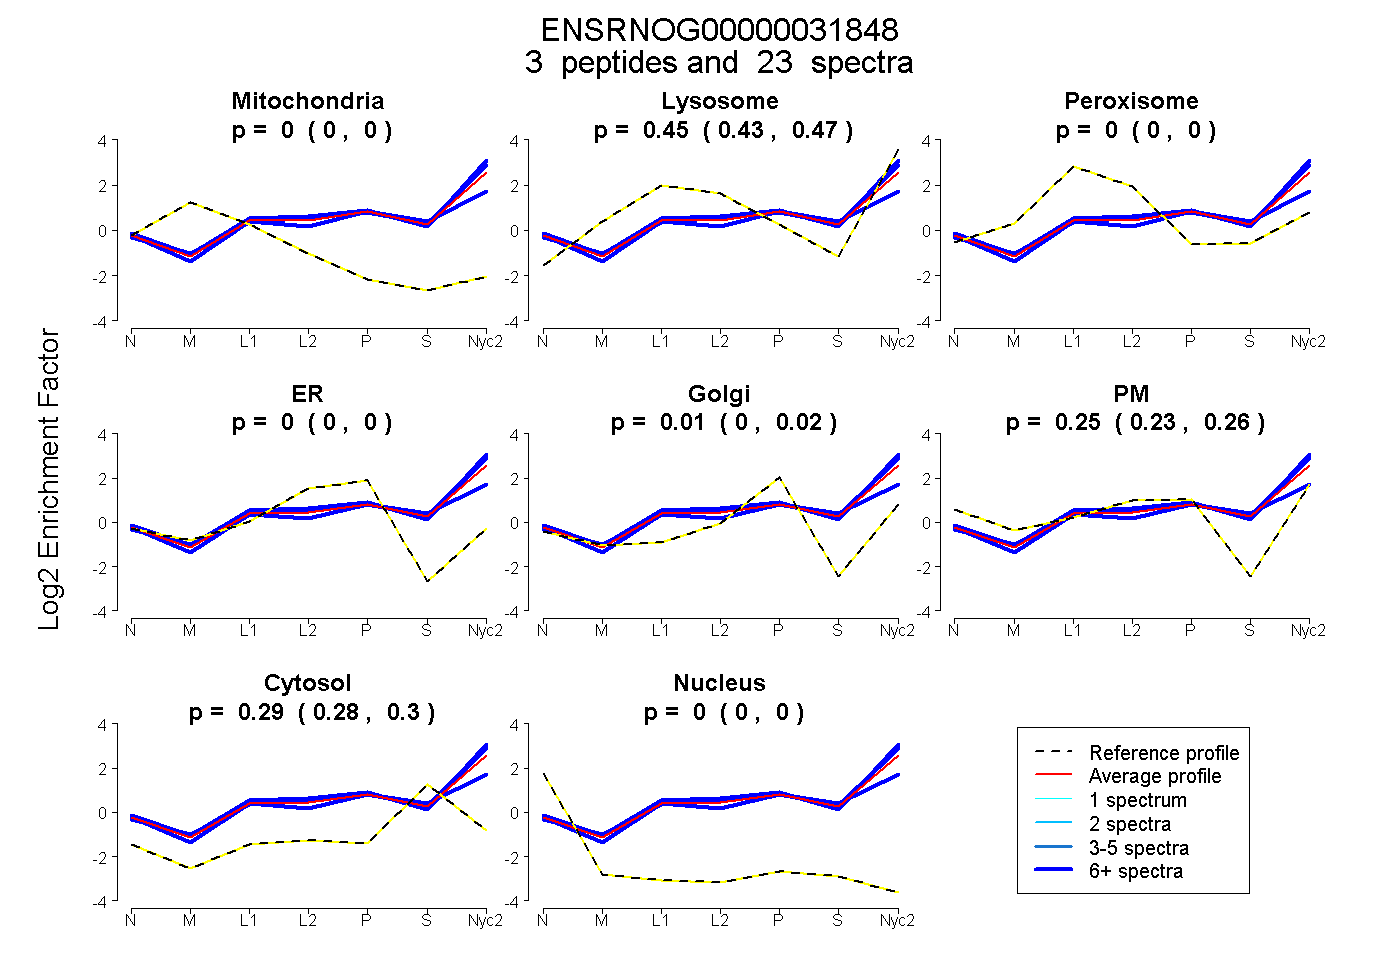
0.000 | 0.000
0.428 | 0.471
0.000 | 0.000
0.000 | 0.000
0.000 | 0.022
0.225 | 0.261
0.280 | 0.301
0.000 | 0.000
| Plot | Mito | Lyso | Perox | ER | Golgi | PM | Cytosol | Nucleus | |||||
| Expt A |
3 peptides |
23 spectra |
|
0.000 0.000 | 0.000 |
0.451 0.428 | 0.471 |
0.000 0.000 | 0.000 |
0.000 0.000 | 0.000 |
0.012 0.000 | 0.022 |
0.246 0.225 | 0.261 |
0.292 0.280 | 0.301 |
0.000 0.000 | 0.000 |
| 11 spectra, STLYLQMDSLR | 0.000 | 0.510 | 0.000 | 0.000 | 0.010 | 0.210 | 0.270 | 0.000 | ||
| 6 spectra, STLYLQMNSLR | 0.000 | 0.509 | 0.000 | 0.000 | 0.000 | 0.264 | 0.227 | 0.000 | ||
| 6 spectra, SEDTATYYCAR | 0.000 | 0.332 | 0.000 | 0.000 | 0.049 | 0.246 | 0.373 | 0.000 |
| Plot | Mito | Lyso or Perox | ER | Golgi | PM | Cytosol | Nucleus | ||||||
| Expt B |
1 peptide |
1 spectrum |
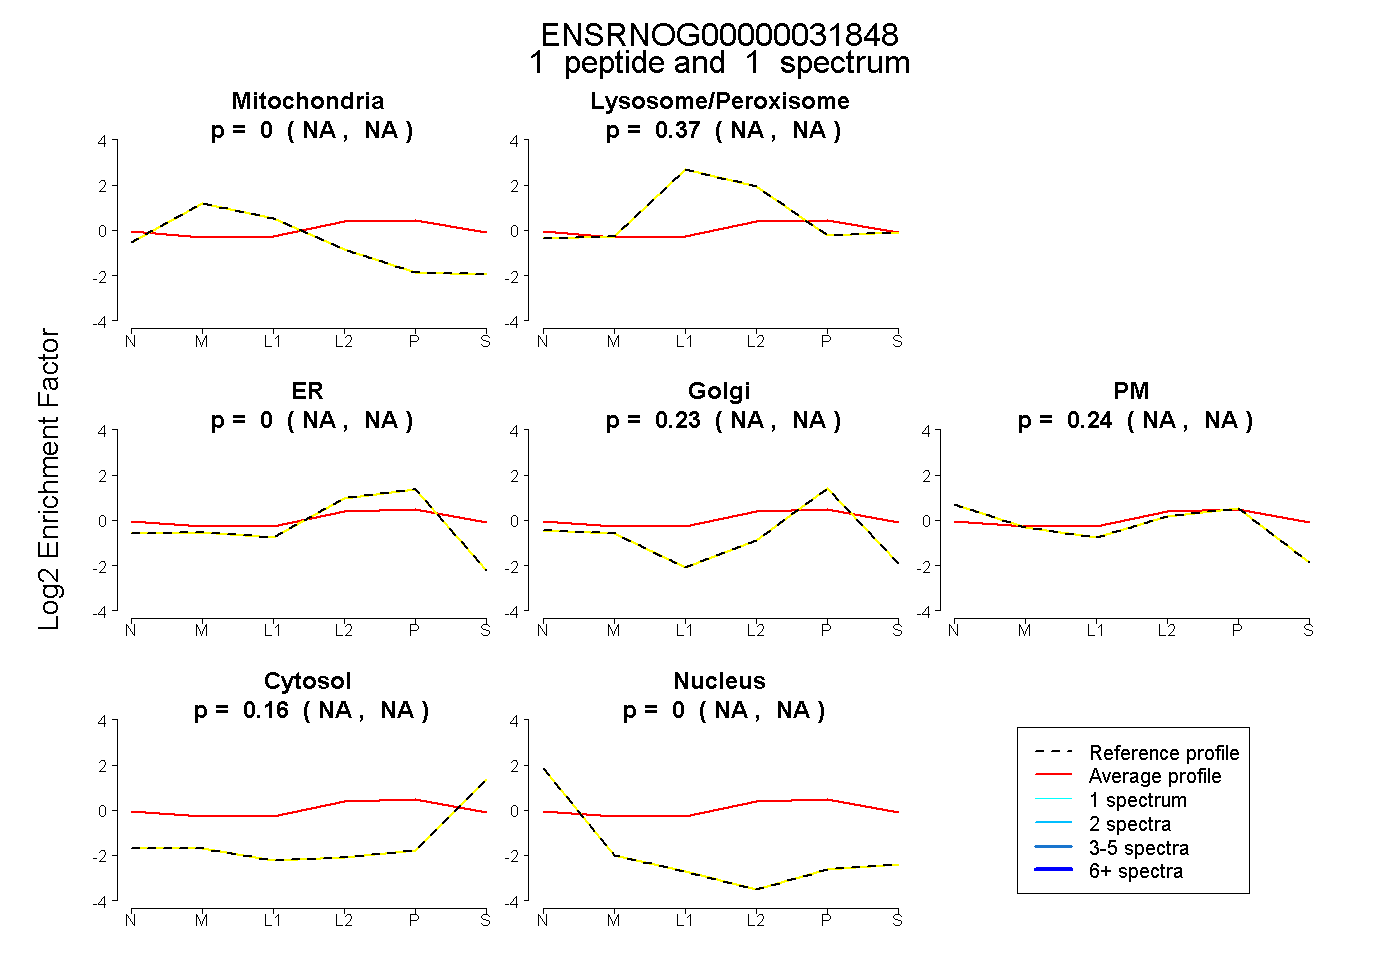 |
0.000 NA | NA |
0.371 NA | NA |
0.000 NA | NA |
0.234 NA | NA |
0.235 NA | NA |
0.160 NA | NA |
0.000 NA | NA |
|||
| Plot | Lyso | Other | |||||||||||
| Expt C |
1 peptide |
9 spectra |
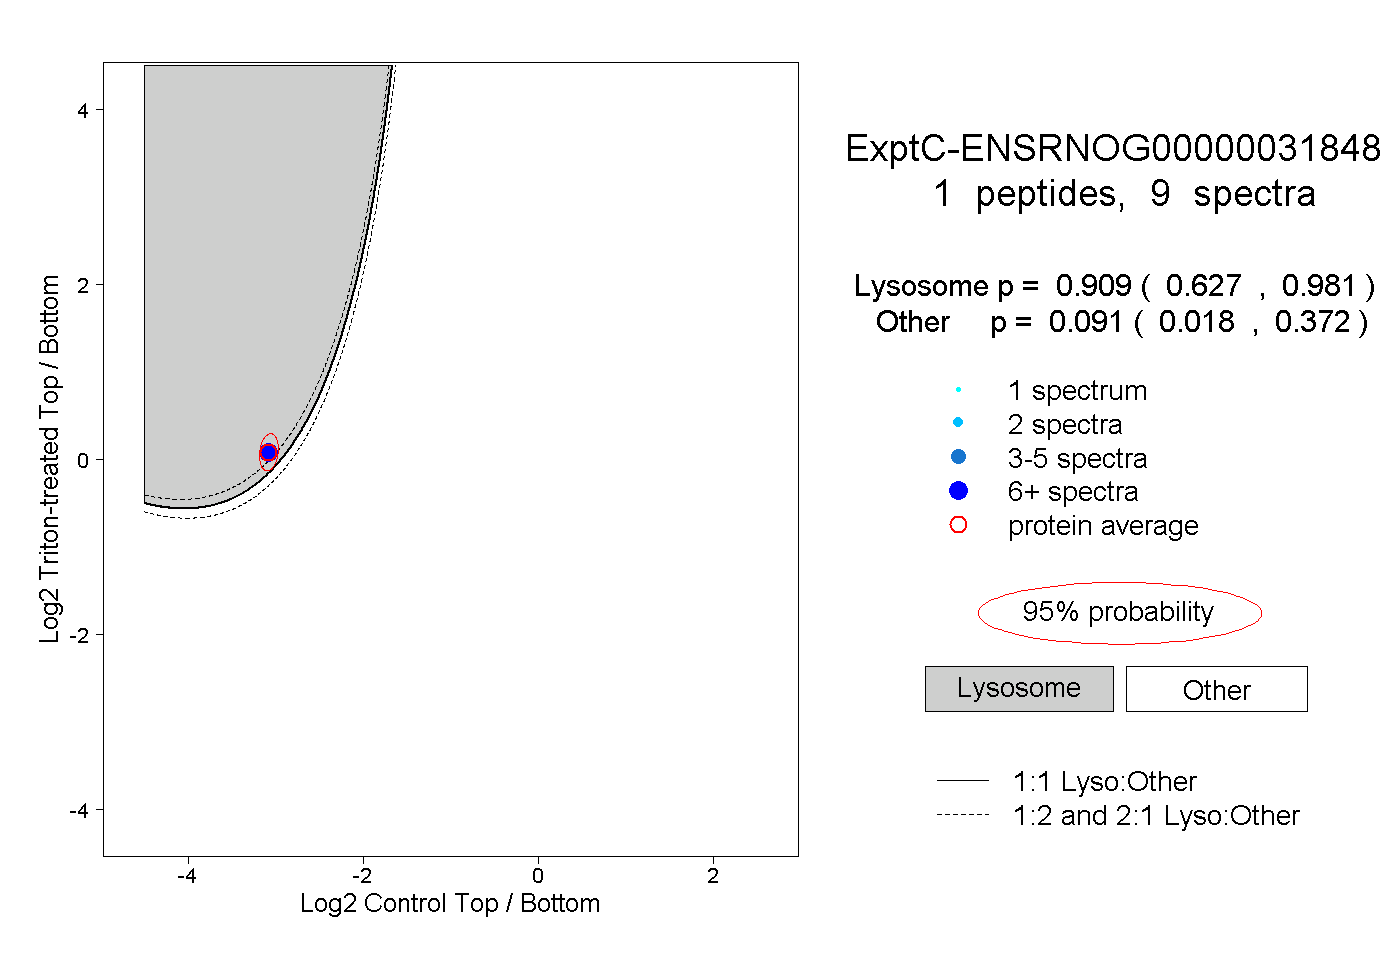 |
0.909 0.627 | 0.981 |
0.091 0.018 | 0.372 |