 4
4peptides
spectra
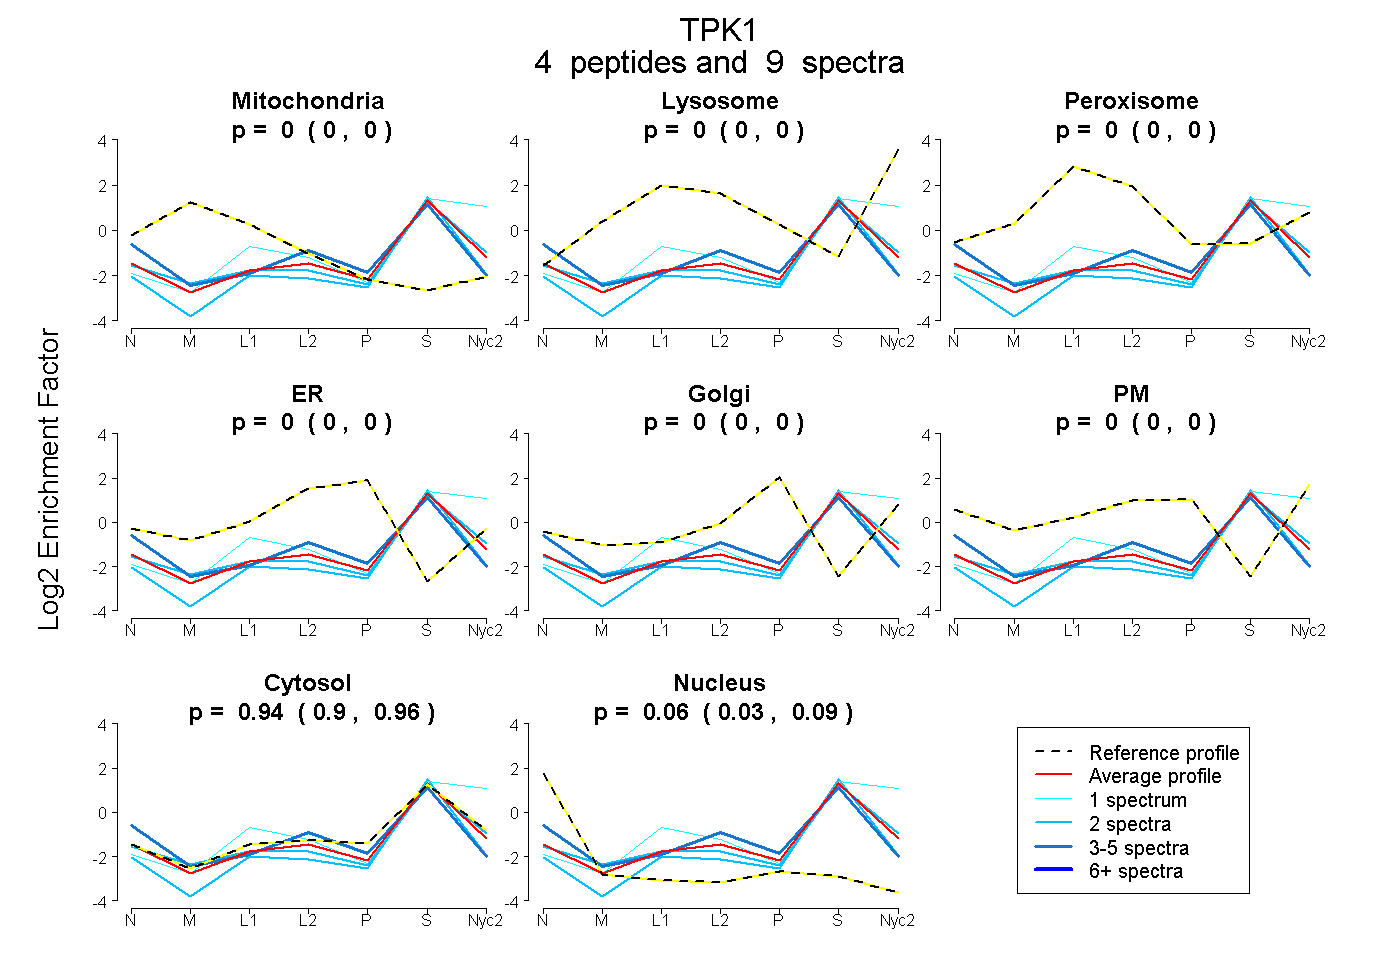
0.000 | 0.000
0.000 | 0.000
0.000 | 0.000
0.000 | 0.000
0.000 | 0.000
0.000 | 0.000
0.902 | 0.965
0.028 | 0.094
2peptides
spectra
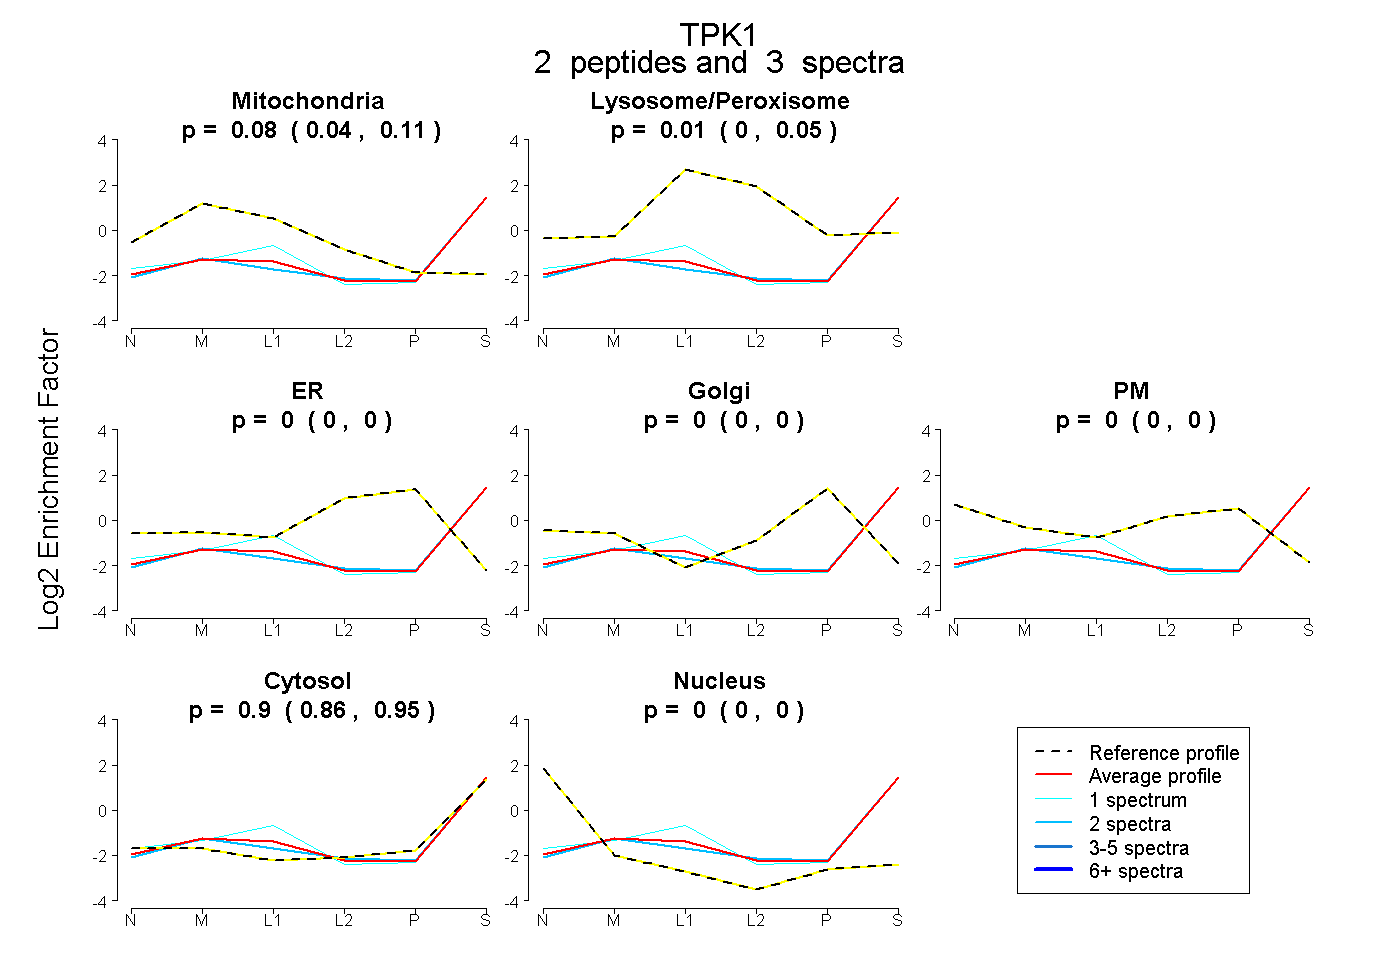
0.038 | 0.114
0.000 | 0.050
0.000 | 0.000
0.000 | 0.000
0.000 | 0.000
0.855 | 0.945
0.000 | 0.000
2peptides
spectra
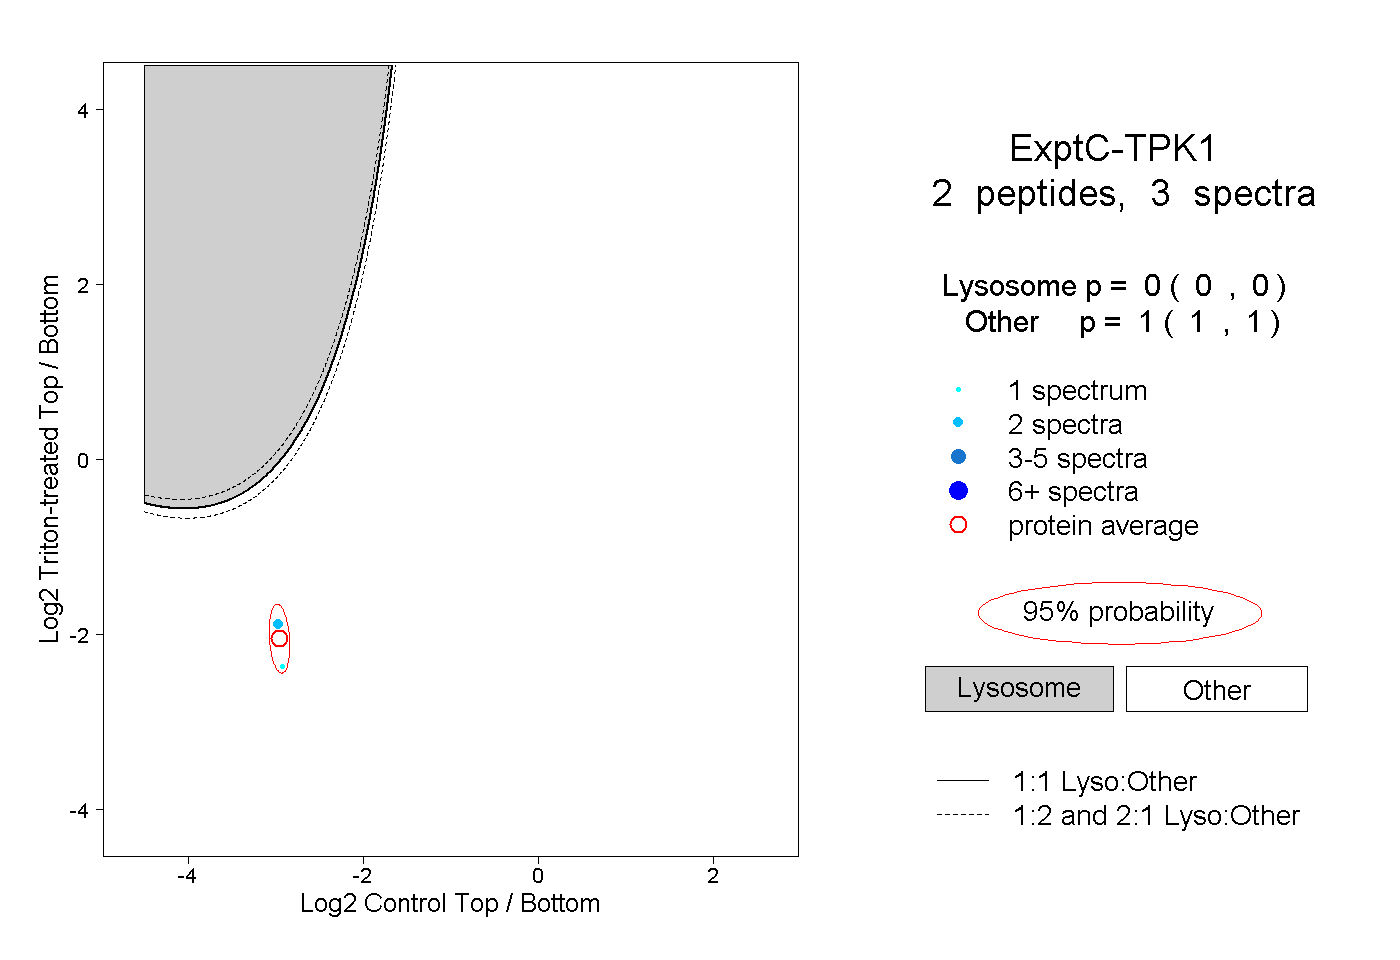
0.000 | 0.000
1.000 | 1.000