 4
4peptides
spectra
0.000 | 0.000
0.000 | 0.000
0.000 | 0.000
0.000 | 0.000
0.000 | 0.000
0.000 | 0.000
0.902 | 0.965
0.028 | 0.094
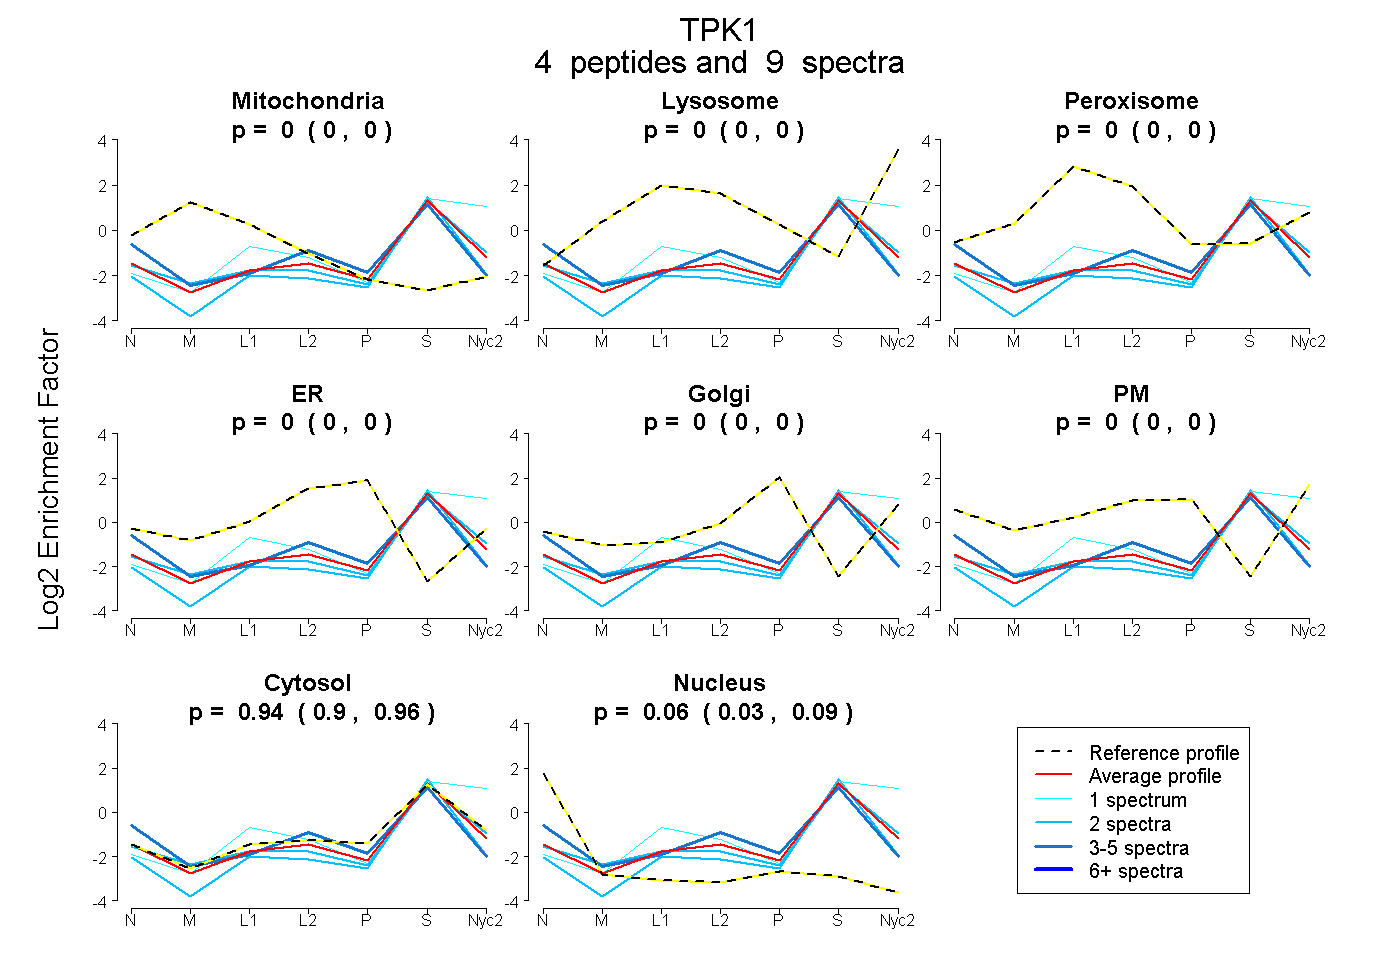
| Plot | Mito | Lyso | Perox | ER | Golgi | PM | Cytosol | Nucleus | |||||
| Expt A |
4 peptides |
9 spectra |
|
0.000 0.000 | 0.000 |
0.000 0.000 | 0.000 |
0.000 0.000 | 0.000 |
0.000 0.000 | 0.000 |
0.000 0.000 | 0.000 |
0.000 0.000 | 0.000 |
0.937 0.902 | 0.965 |
0.063 0.028 | 0.094 |
| 2 spectra, ACADGGANHLYDLTEGER | 0.000 | 0.000 | 0.000 | 0.000 | 0.000 | 0.000 | 0.893 | 0.107 | ||
| 2 spectra, ESLIYLLQPGK | 0.000 | 0.000 | 0.000 | 0.000 | 0.000 | 0.000 | 0.939 | 0.061 | ||
| 4 spectra, FCLVVLNQTLDPHFR | 0.000 | 0.000 | 0.000 | 0.000 | 0.000 | 0.000 | 0.836 | 0.164 | ||
| 1 spectrum, CLQVLQR | 0.000 | 0.152 | 0.000 | 0.000 | 0.000 | 0.000 | 0.848 | 0.000 |
| Plot | Mito | Lyso or Perox | ER | Golgi | PM | Cytosol | Nucleus | ||||||
| Expt B |
2 peptides |
3 spectra |
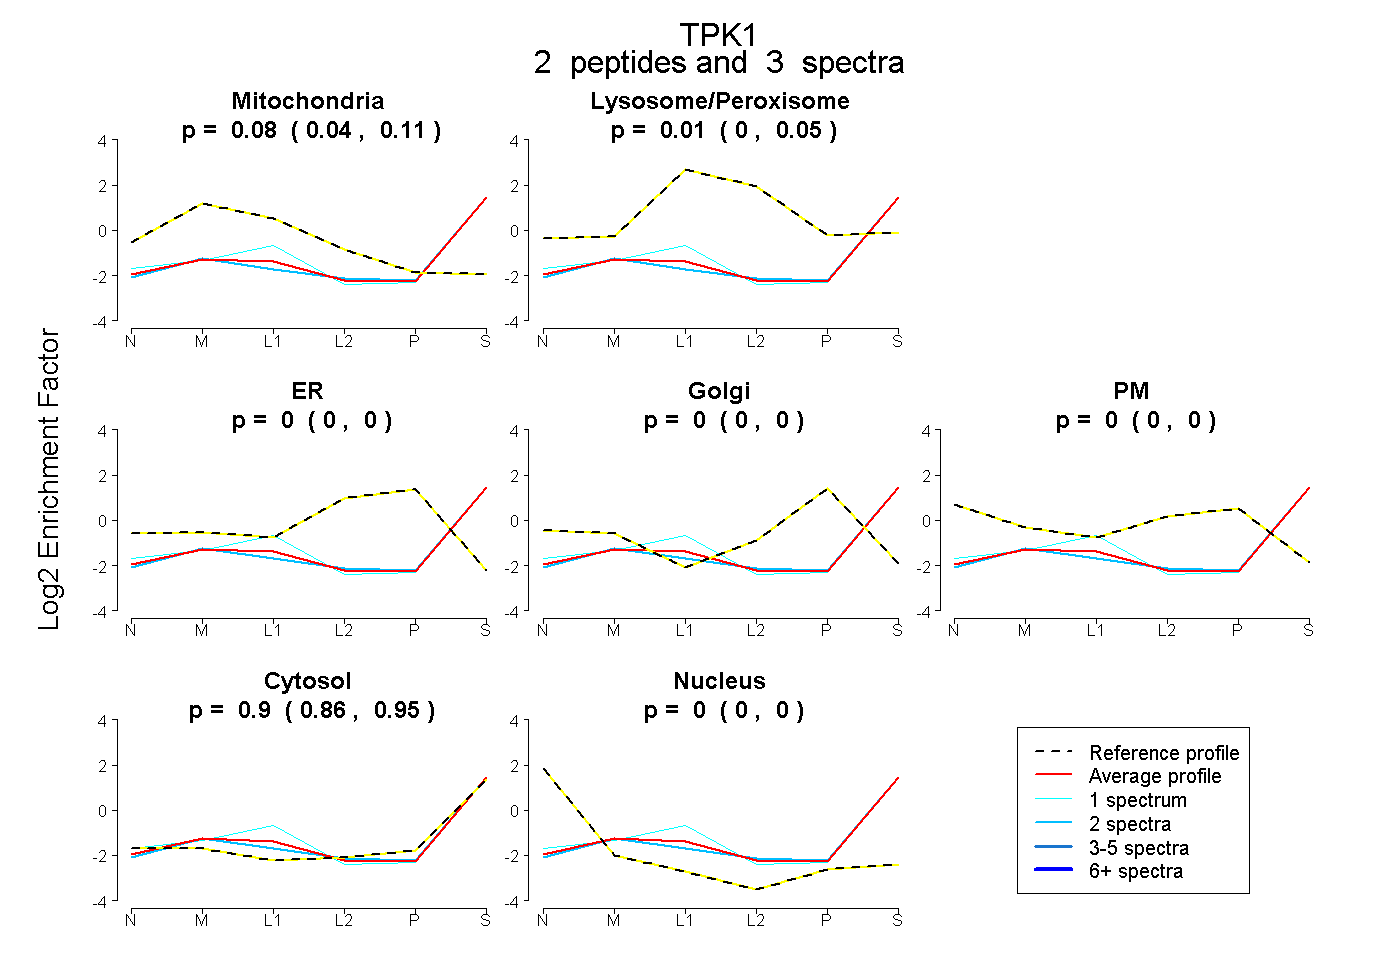 |
0.084 0.038 | 0.114 |
0.012 0.000 | 0.050 |
0.000 0.000 | 0.000 |
0.000 0.000 | 0.000 |
0.000 0.000 | 0.000 |
0.904 0.855 | 0.945 |
0.000 0.000 | 0.000 |
|||
| Plot | Lyso | Other | |||||||||||
| Expt C |
2 peptides |
3 spectra |
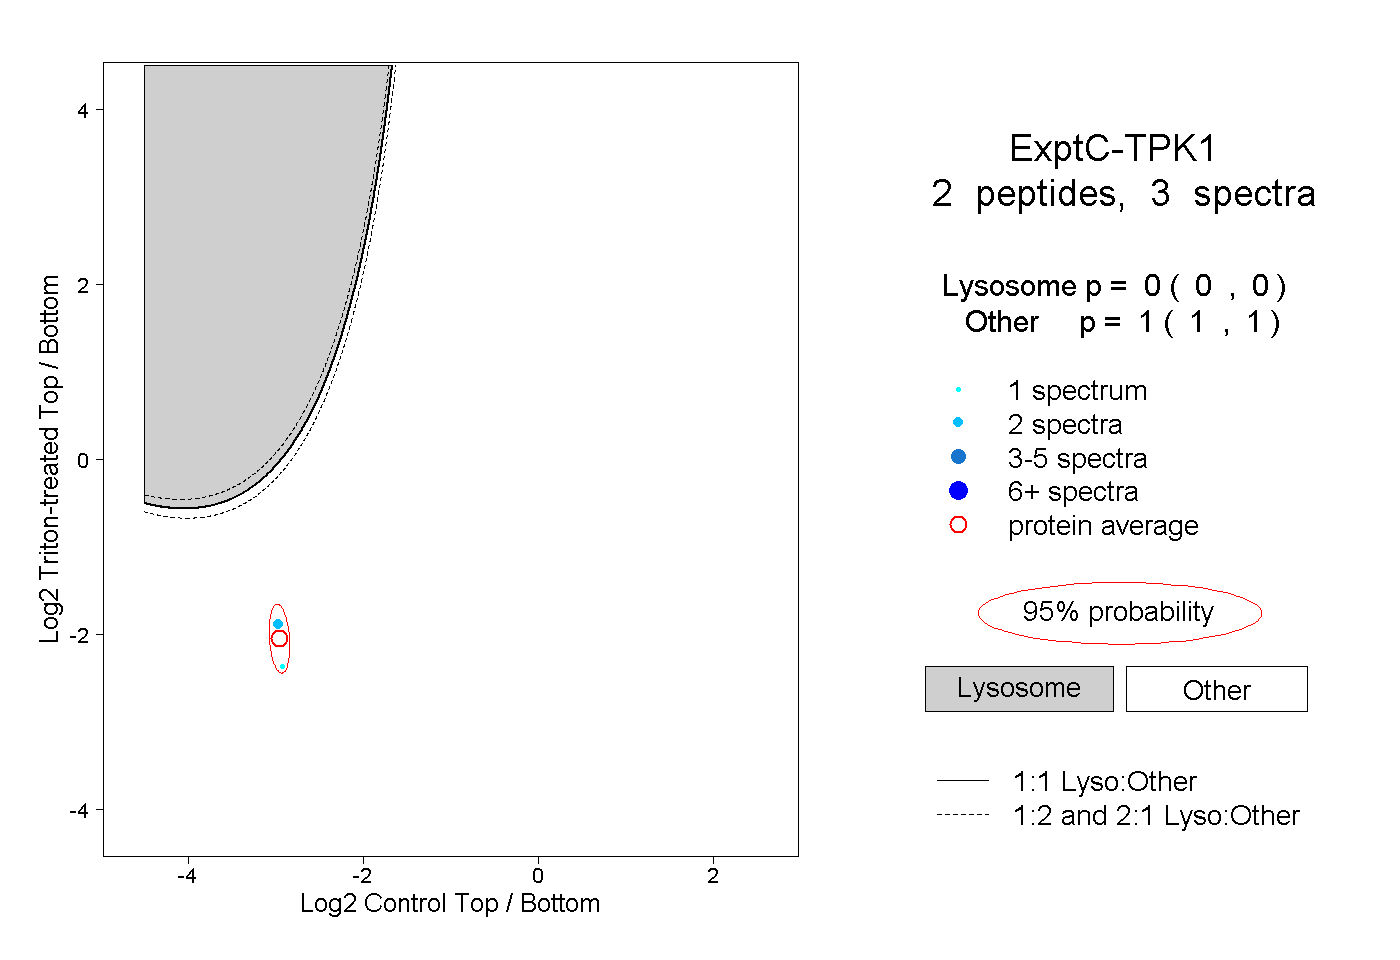 |
0.000 0.000 | 0.000 |
1.000 1.000 | 1.000 |