 7
7peptides
spectra
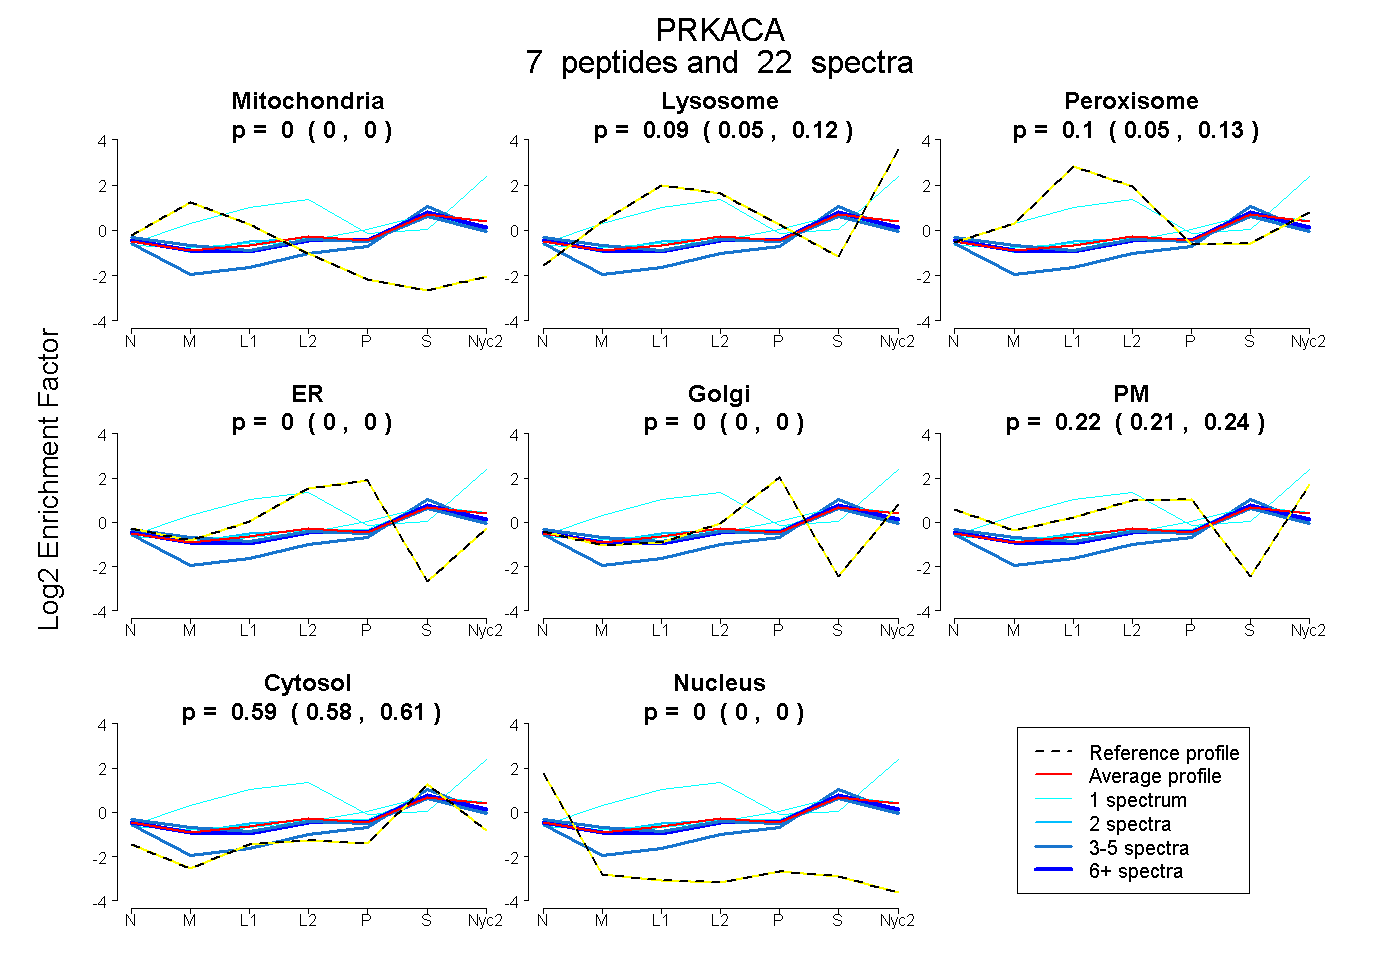
0.000 | 0.000
0.048 | 0.124
0.055 | 0.130
0.000 | 0.000
0.000 | 0.000
0.206 | 0.236
0.581 | 0.606
0.000 | 0.000
1peptide
spectrum
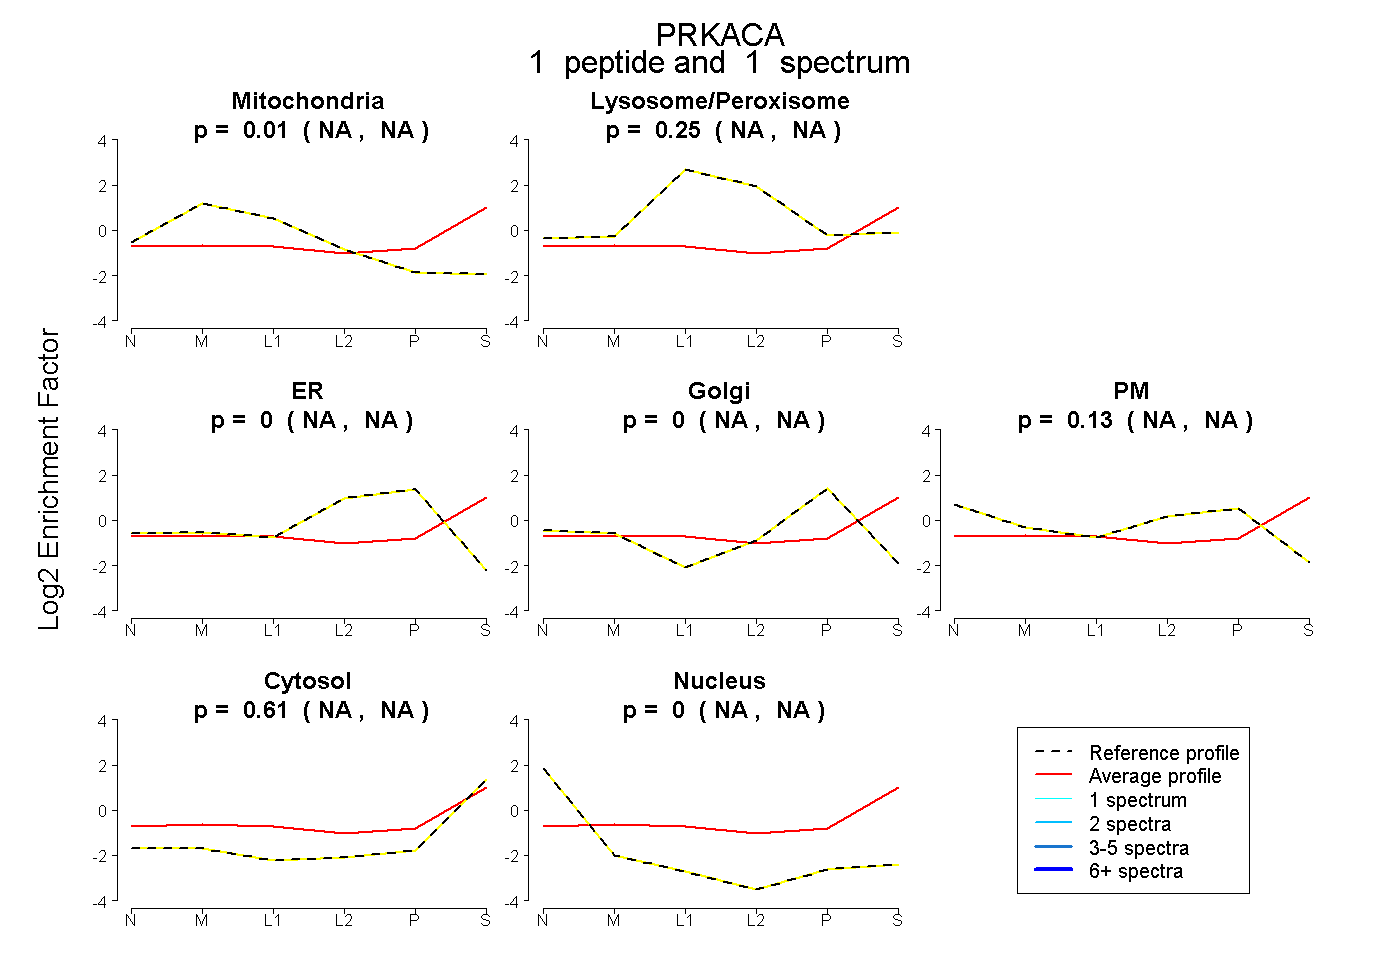
NA | NA
NA | NA
NA | NA
NA | NA
NA | NA
NA | NA
NA | NA
8peptides
spectra
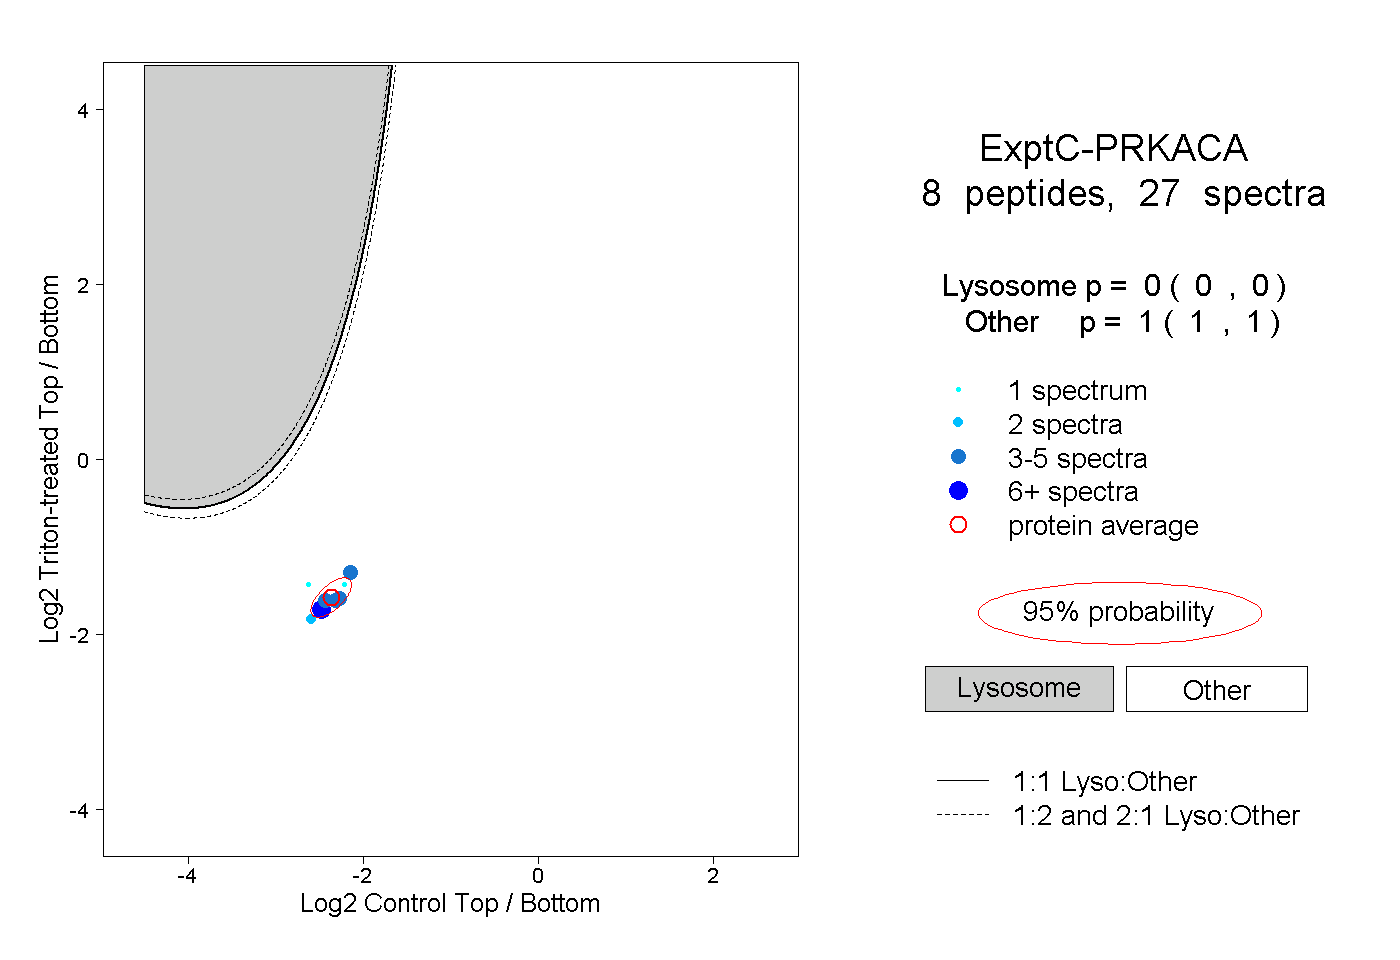
0.000 | 0.000
1.000 | 1.000
2peptides
spectra
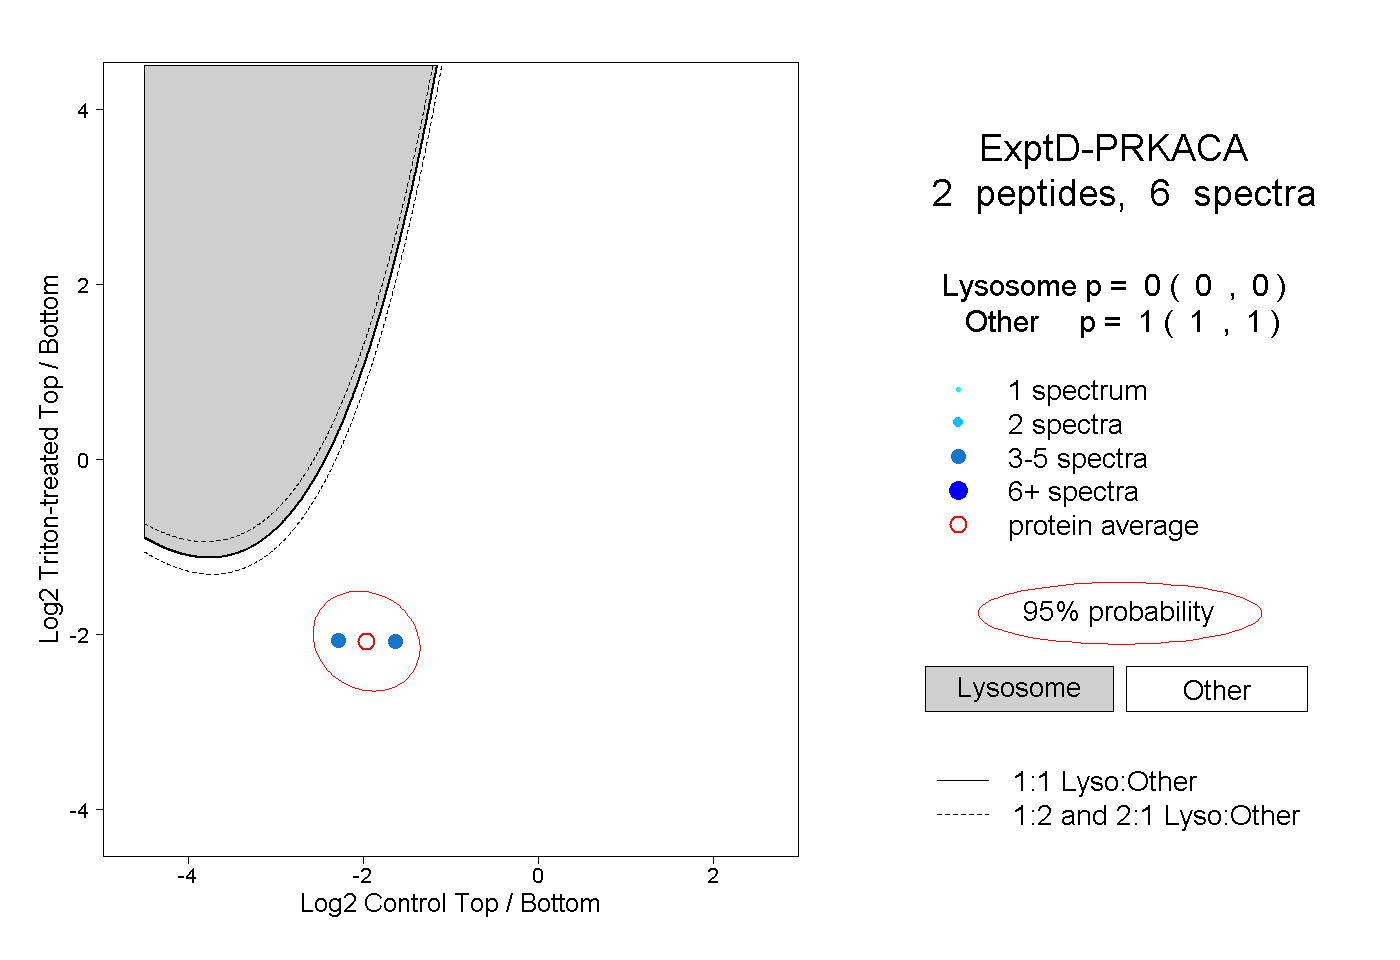
0.000 | 0.000
1.000 | 1.000