 7
7peptides
spectra
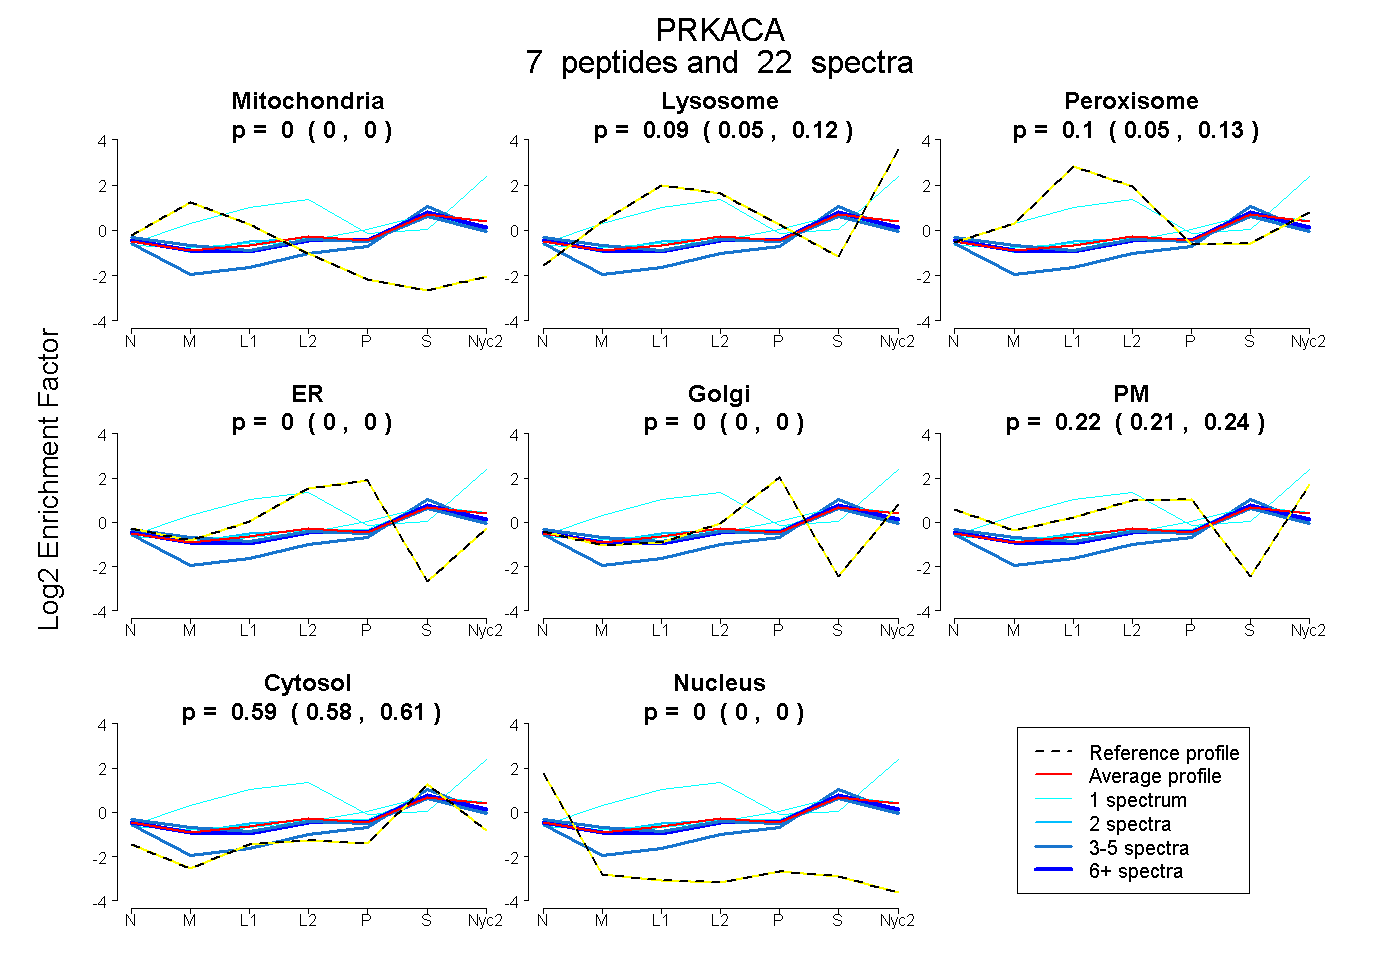
0.000 | 0.000
0.048 | 0.124
0.055 | 0.130
0.000 | 0.000
0.000 | 0.000
0.206 | 0.236
0.581 | 0.606
0.000 | 0.000
| Plot | Mito | Lyso | Perox | ER | Golgi | PM | Cytosol | Nucleus | |||||
| Expt A |
7 peptides |
22 spectra |
|
0.000 0.000 | 0.000 |
0.087 0.048 | 0.124 |
0.095 0.055 | 0.130 |
0.000 0.000 | 0.000 |
0.000 0.000 | 0.000 |
0.223 0.206 | 0.236 |
0.594 0.581 | 0.606 |
0.000 0.000 | 0.000 |
| 4 spectra, WETPSQNTAQLDHFDR | 0.055 | 0.000 | 0.096 | 0.000 | 0.000 | 0.258 | 0.591 | 0.000 | ||
| 10 spectra, TLGTGSFGR | 0.003 | 0.030 | 0.072 | 0.000 | 0.000 | 0.252 | 0.642 | 0.000 | ||
| 3 spectra, LEFSFK | 0.000 | 0.000 | 0.000 | 0.000 | 0.007 | 0.178 | 0.815 | 0.000 | ||
| 1 spectrum, EDFLK | 0.000 | 0.569 | 0.189 | 0.000 | 0.000 | 0.069 | 0.174 | 0.000 | ||
| 1 spectrum, NLLQVDLTK | 0.000 | 0.106 | 0.024 | 0.000 | 0.015 | 0.265 | 0.590 | 0.000 | ||
| 2 spectra, DNSNLYMVMEYVPGGEMFSHLR | 0.000 | 0.000 | 0.181 | 0.000 | 0.000 | 0.216 | 0.602 | 0.000 | ||
| 1 spectrum, FPSHFSSDLK | 0.007 | 0.002 | 0.209 | 0.000 | 0.073 | 0.114 | 0.594 | 0.000 |
| Plot | Mito | Lyso or Perox | ER | Golgi | PM | Cytosol | Nucleus | ||||||
| Expt B |
1 peptide |
1 spectrum |
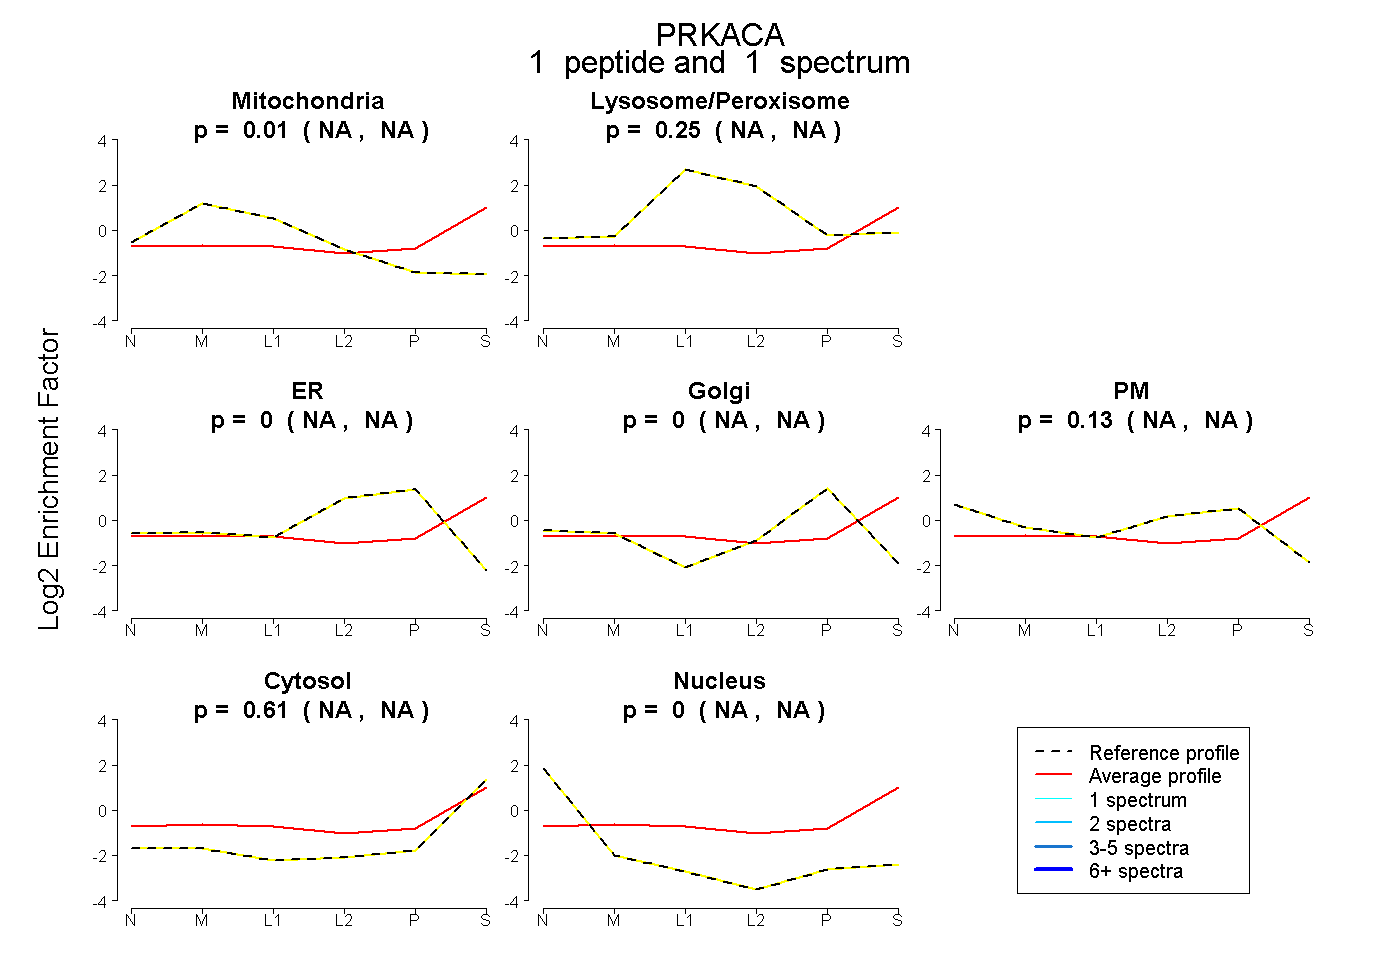 |
0.010 NA | NA |
0.250 NA | NA |
0.000 NA | NA |
0.000 NA | NA |
0.133 NA | NA |
0.607 NA | NA |
0.000 NA | NA |
|||
| Plot | Lyso | Other | |||||||||||
| Expt C |
8 peptides |
27 spectra |
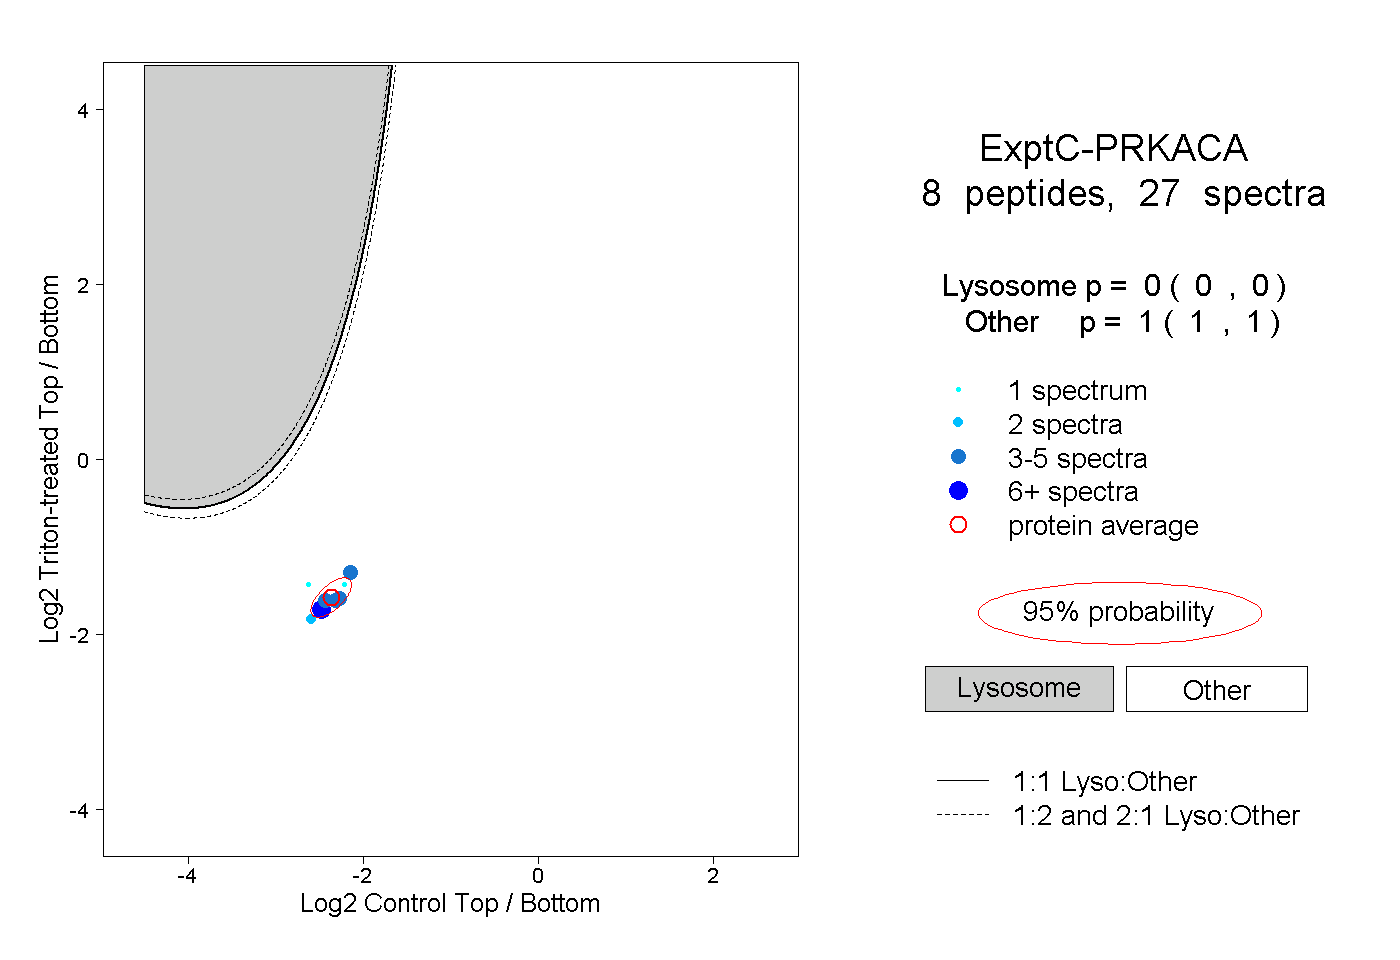 |
0.000 0.000 | 0.000 |
1.000 1.000 | 1.000 |
||||||||
| Plot | Lyso | Other | |||||||||||
| Expt D |
2 peptides |
6 spectra |
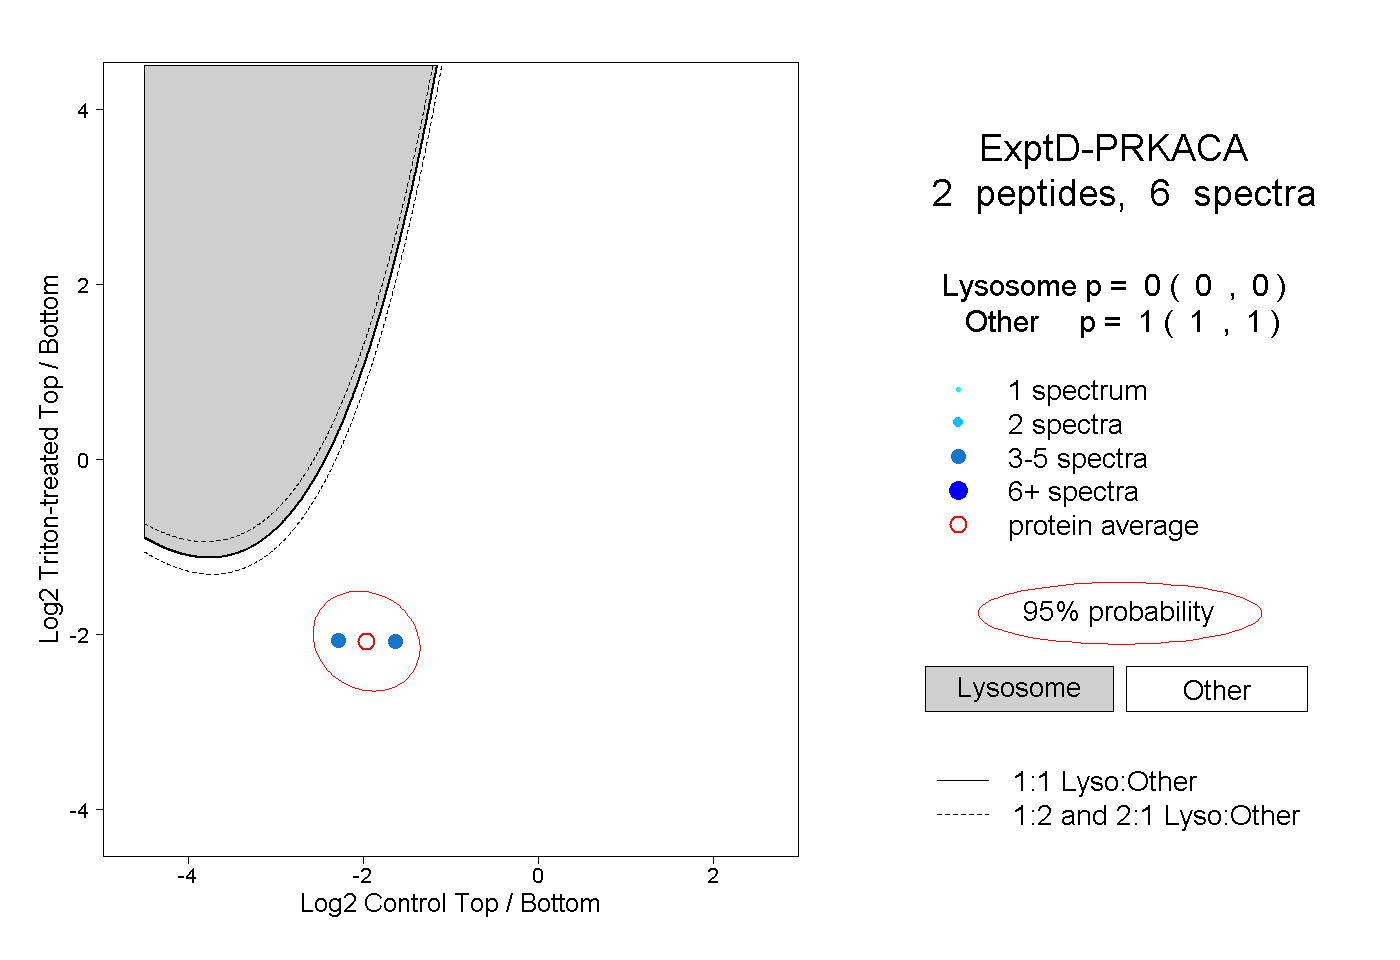 |
0.000 0.000 | 0.000 |
1.000 1.000 | 1.000 |