 25
25peptides
spectra
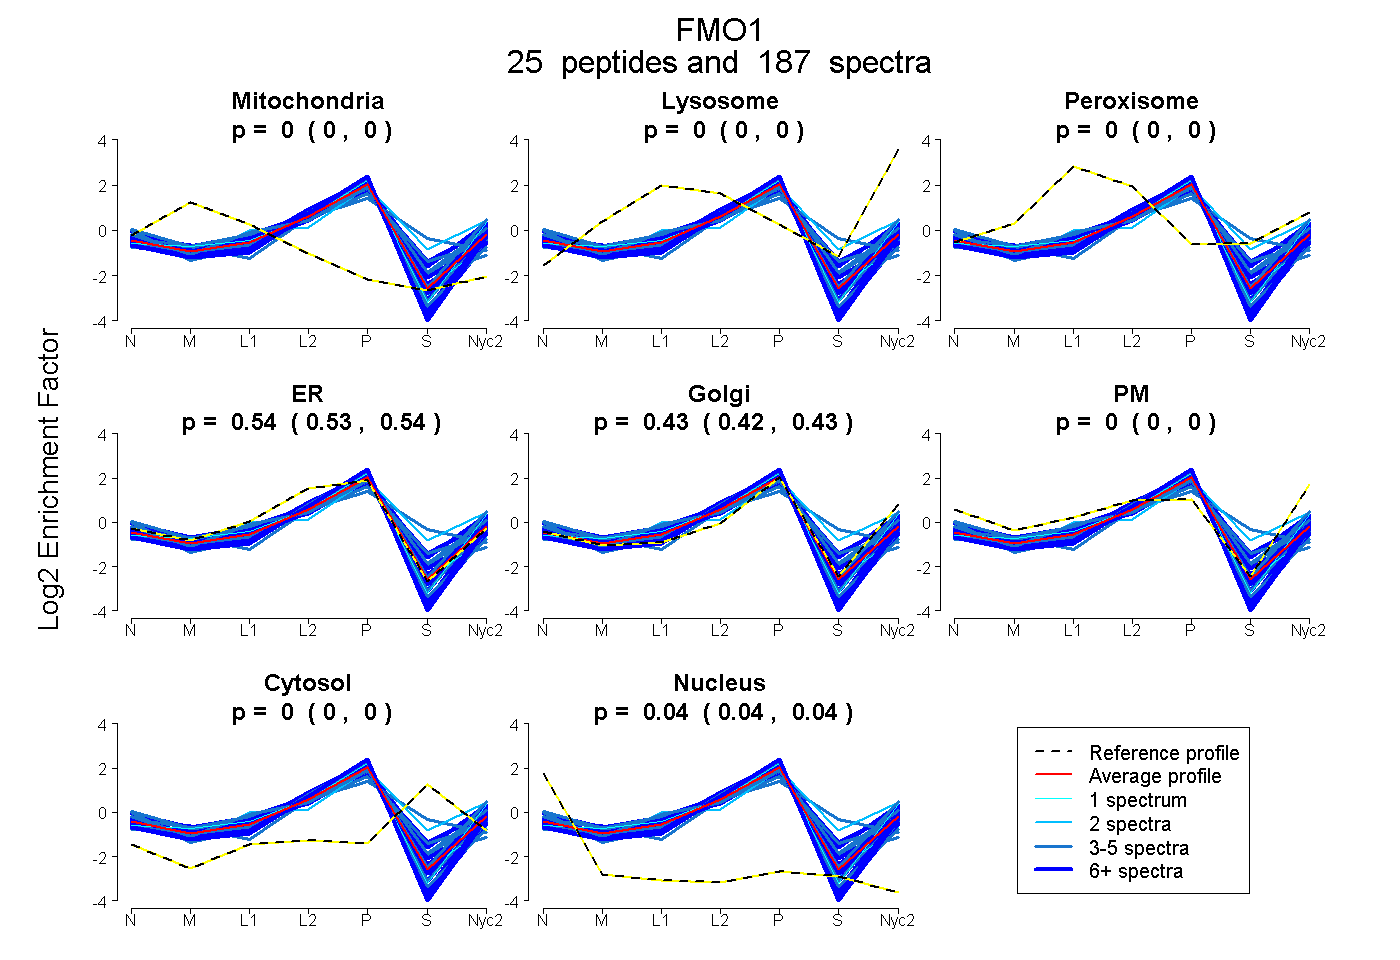
0.000 | 0.000
0.000 | 0.000
0.000 | 0.000
0.533 | 0.541
0.421 | 0.429
0.000 | 0.000
0.000 | 0.000
0.036 | 0.038
20peptides
spectra
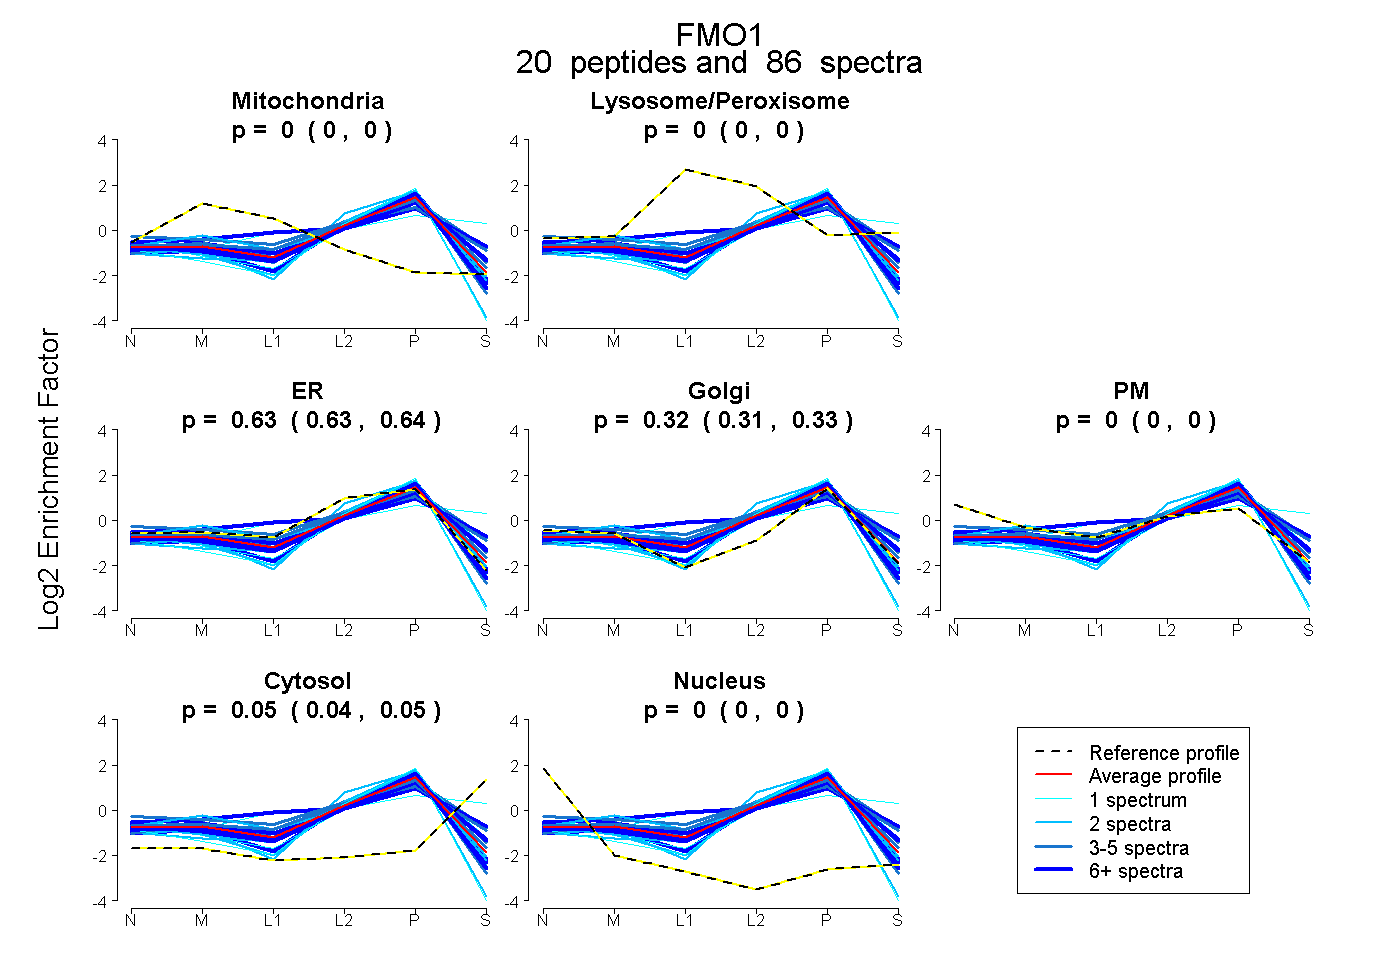
0.000 | 0.000
0.000 | 0.000
0.627 | 0.640
0.308 | 0.327
0.000 | 0.000
0.042 | 0.053
0.000 | 0.000
23peptides
spectra
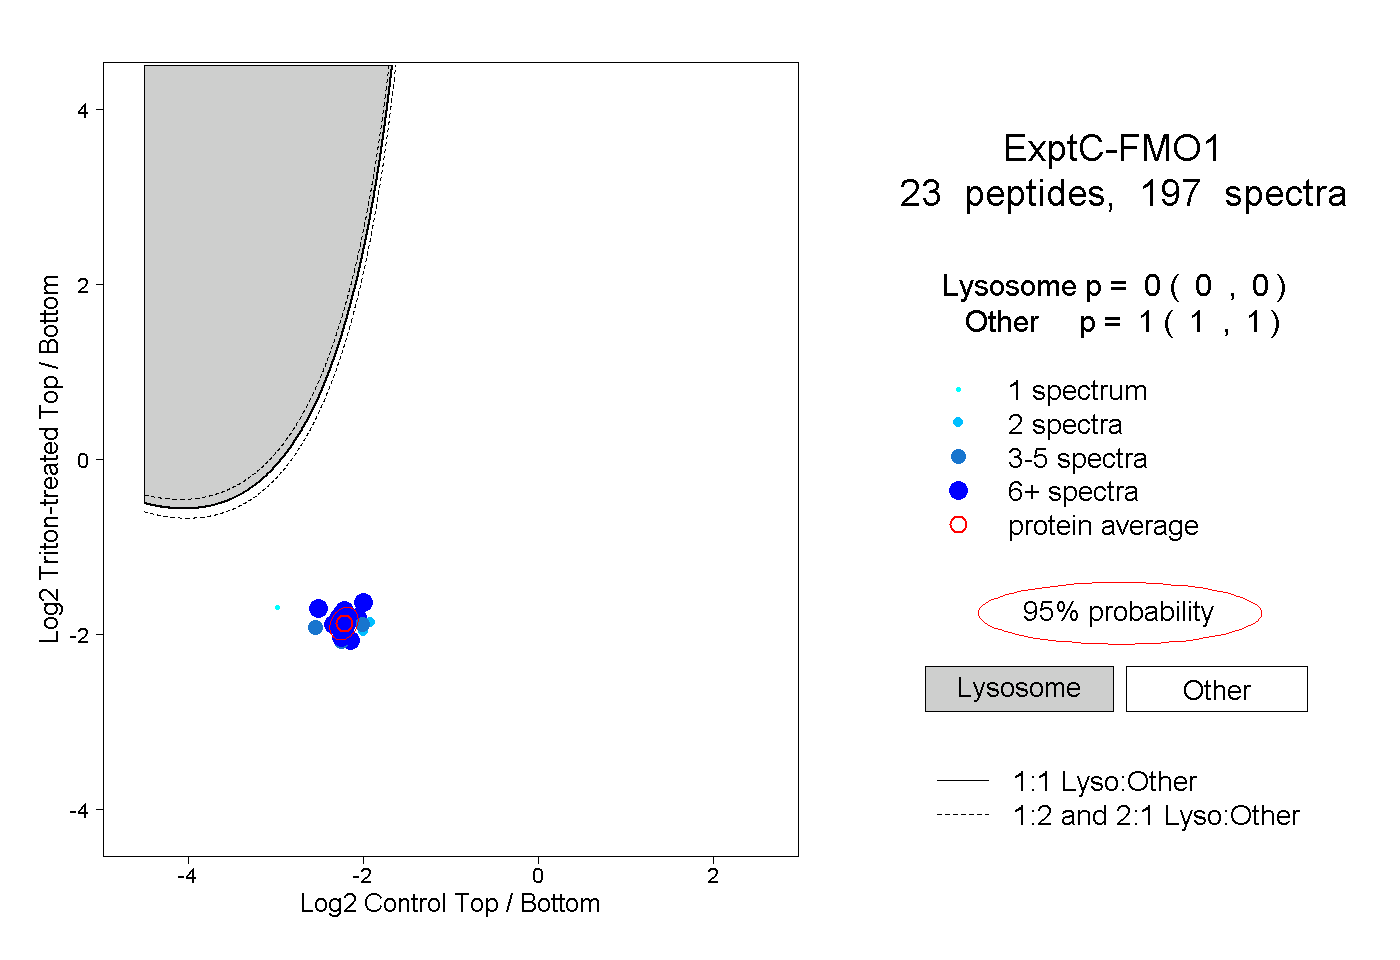
0.000 | 0.000
1.000 | 1.000
12peptides
spectra
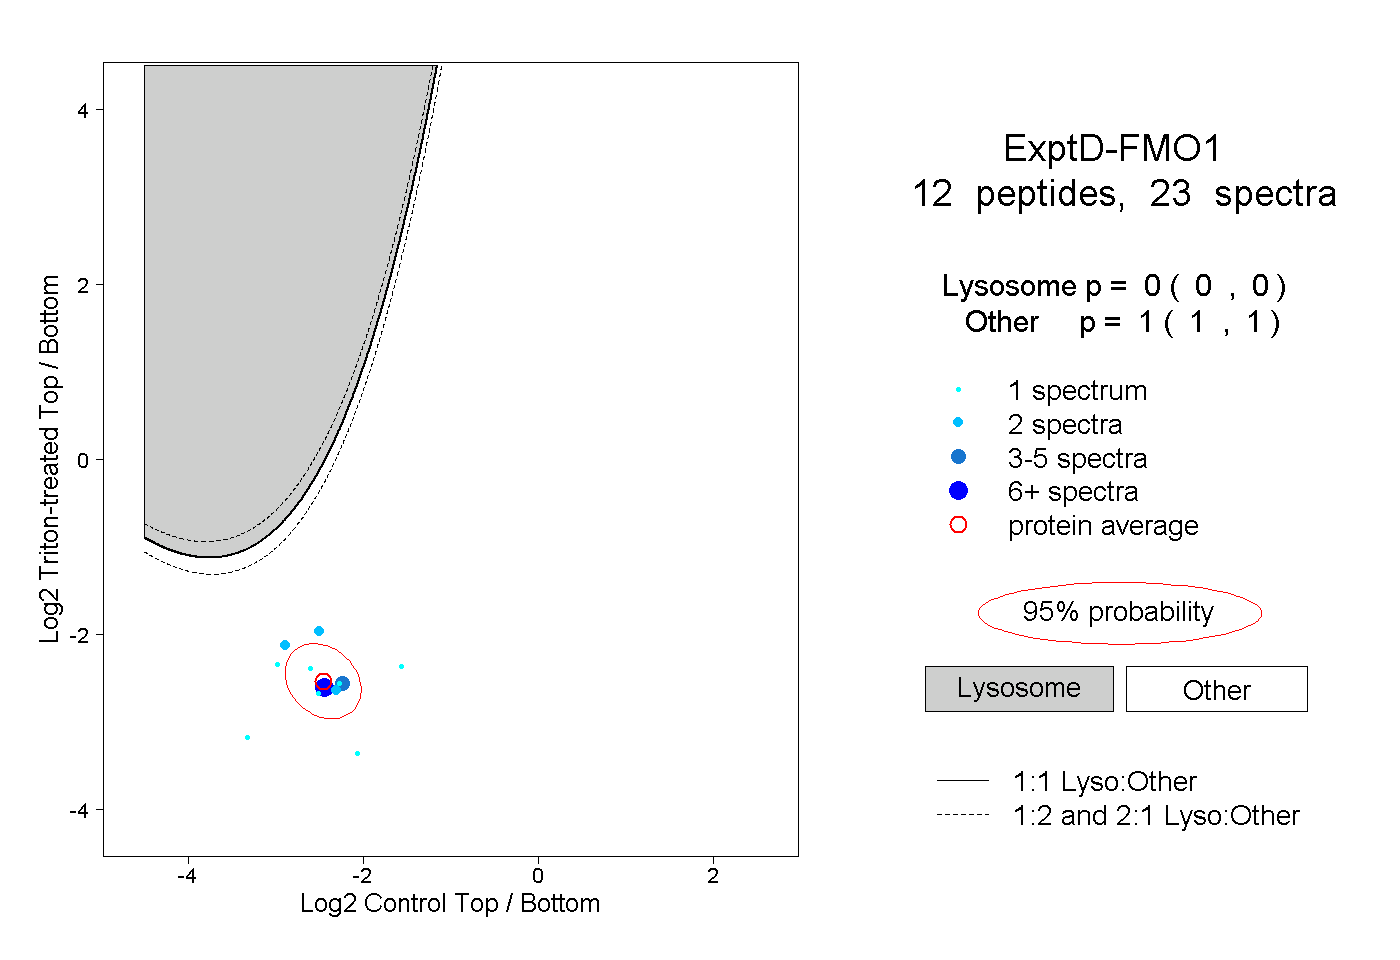
0.000 | 0.000
1.000 | 1.000