 25
25peptides
spectra
0.000 | 0.000
0.000 | 0.000
0.000 | 0.000
0.533 | 0.541
0.421 | 0.429
0.000 | 0.000
0.000 | 0.000
0.036 | 0.038
| Plot | Mito | Lyso | Perox | ER | Golgi | PM | Cytosol | Nucleus | |||||
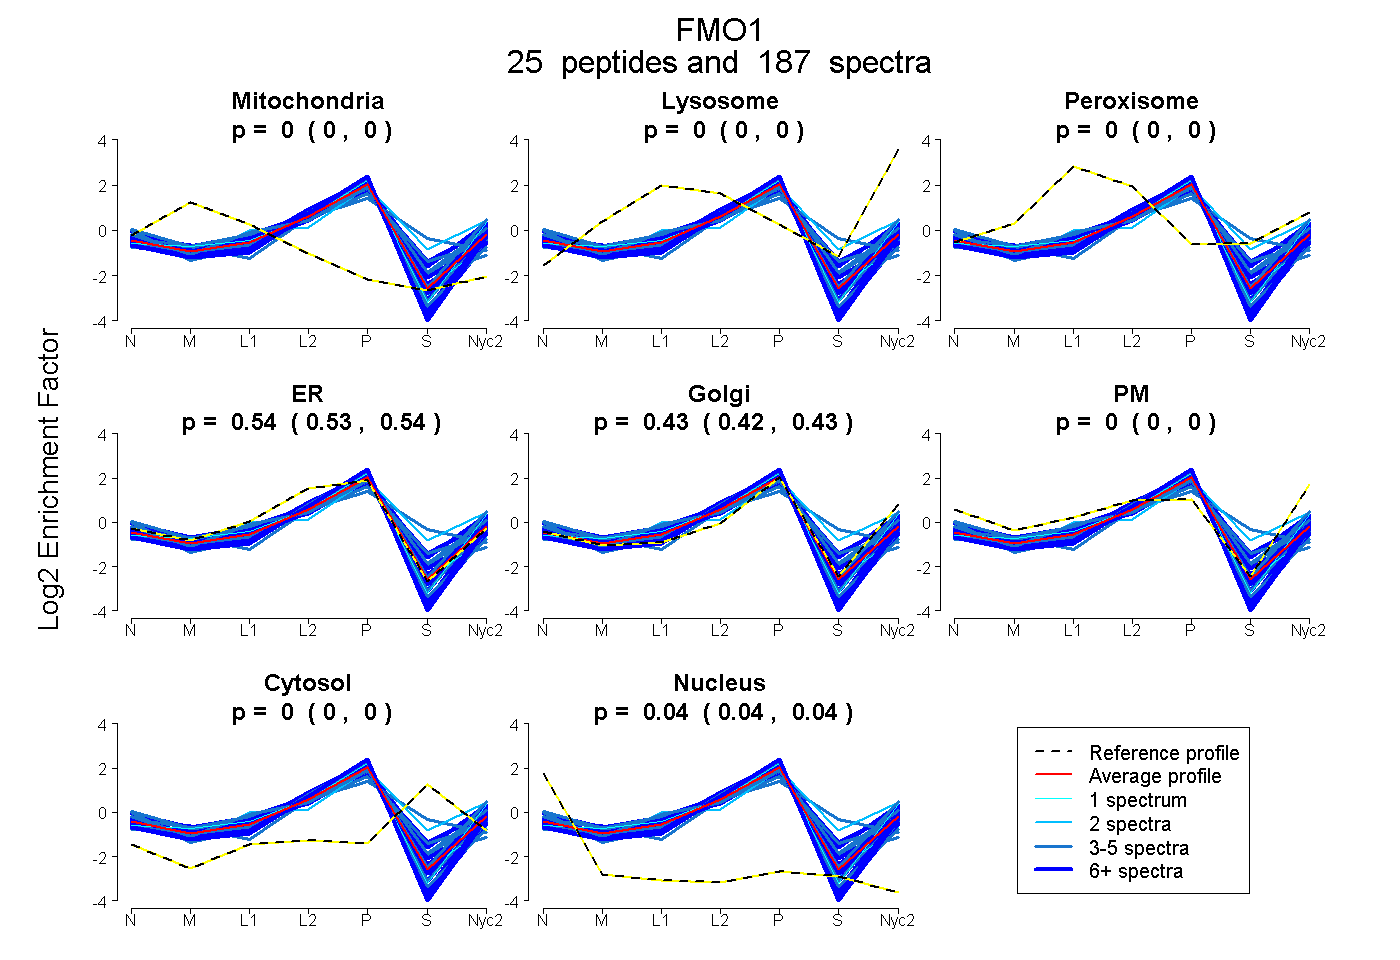
| Expt A |
25 peptides |
187 spectra |
|
0.000 0.000 | 0.000 |
0.000 0.000 | 0.000 |
0.000 0.000 | 0.000 |
0.538 0.533 | 0.541 |
0.425 0.421 | 0.429 |
0.000 0.000 | 0.000 |
0.000 0.000 | 0.000 |
0.037 0.036 | 0.038 |
| 5 spectra, LTGPGK | 0.022 | 0.000 | 0.000 | 0.448 | 0.501 | 0.000 | 0.000 | 0.029 | ||
| 7 spectra, WVVQVLK | 0.000 | 0.000 | 0.000 | 0.553 | 0.411 | 0.000 | 0.000 | 0.036 | ||
| 3 spectra, HSGFGLCYCK | 0.000 | 0.000 | 0.000 | 0.580 | 0.033 | 0.000 | 0.387 | 0.000 | ||
| 7 spectra, VFLSTTGGAWVISR | 0.000 | 0.000 | 0.000 | 0.512 | 0.481 | 0.000 | 0.000 | 0.008 | ||
| 5 spectra, TVNVTK | 0.000 | 0.000 | 0.000 | 0.635 | 0.322 | 0.000 | 0.000 | 0.044 | ||
| 27 spectra, GATTLPPPSVMMK | 0.000 | 0.000 | 0.068 | 0.293 | 0.539 | 0.000 | 0.099 | 0.000 | ||
| 16 spectra, FTEHVEEGR | 0.032 | 0.000 | 0.000 | 0.546 | 0.362 | 0.000 | 0.007 | 0.054 | ||
| 4 spectra, VCSITK | 0.000 | 0.000 | 0.000 | 0.722 | 0.215 | 0.000 | 0.000 | 0.064 | ||
| 12 spectra, VAIVGAGVSGLASIK | 0.000 | 0.000 | 0.000 | 0.559 | 0.326 | 0.000 | 0.089 | 0.027 | ||
| 20 spectra, FQNMLR | 0.000 | 0.000 | 0.000 | 0.562 | 0.438 | 0.000 | 0.000 | 0.000 | ||
| 3 spectra, VFDSGYPWDMIFMTR | 0.000 | 0.000 | 0.000 | 0.332 | 0.601 | 0.047 | 0.000 | 0.020 | ||
| 5 spectra, ASLYNSVVSNSSK | 0.016 | 0.000 | 0.000 | 0.464 | 0.406 | 0.000 | 0.114 | 0.000 | ||
| 2 spectra, ENSVVFNNTPK | 0.010 | 0.000 | 0.000 | 0.621 | 0.333 | 0.000 | 0.000 | 0.036 | ||
| 4 spectra, HPDVFK | 0.032 | 0.000 | 0.024 | 0.622 | 0.143 | 0.000 | 0.172 | 0.007 | ||
| 5 spectra, VLIKPSIK | 0.000 | 0.000 | 0.052 | 0.411 | 0.455 | 0.000 | 0.082 | 0.000 | ||
| 10 spectra, EPVLNDELPGR | 0.000 | 0.000 | 0.000 | 0.568 | 0.412 | 0.000 | 0.000 | 0.020 | ||
| 8 spectra, VEDGQASLYK | 0.000 | 0.000 | 0.000 | 0.555 | 0.411 | 0.000 | 0.000 | 0.034 | ||
| 9 spectra, SCDLGGLWR | 0.000 | 0.000 | 0.000 | 0.743 | 0.213 | 0.000 | 0.000 | 0.044 | ||
| 2 spectra, MNSWFNHVNYGVAPEDR | 0.000 | 0.000 | 0.152 | 0.069 | 0.620 | 0.000 | 0.160 | 0.000 | ||
| 1 spectrum, RPDFAVSGQWEVVTVCQGK | 0.000 | 0.000 | 0.000 | 0.661 | 0.255 | 0.000 | 0.000 | 0.084 | ||
| 4 spectra, CIYFNTK | 0.000 | 0.000 | 0.000 | 0.745 | 0.050 | 0.000 | 0.111 | 0.094 | ||
| 6 spectra, AMLLTDPR | 0.000 | 0.000 | 0.000 | 0.511 | 0.489 | 0.000 | 0.000 | 0.000 | ||
| 8 spectra, AILTQWDR | 0.000 | 0.000 | 0.000 | 0.468 | 0.532 | 0.000 | 0.000 | 0.000 | ||
| 13 spectra, GQYFHSR | 0.000 | 0.000 | 0.097 | 0.405 | 0.369 | 0.000 | 0.129 | 0.000 | ||
| 1 spectrum, VLVVGMGNSGTDIAVEASHLAK | 0.000 | 0.000 | 0.000 | 0.453 | 0.547 | 0.000 | 0.000 | 0.000 |
| Plot | Mito | Lyso or Perox | ER | Golgi | PM | Cytosol | Nucleus | ||||||
| Expt B |
20 peptides |
86 spectra |
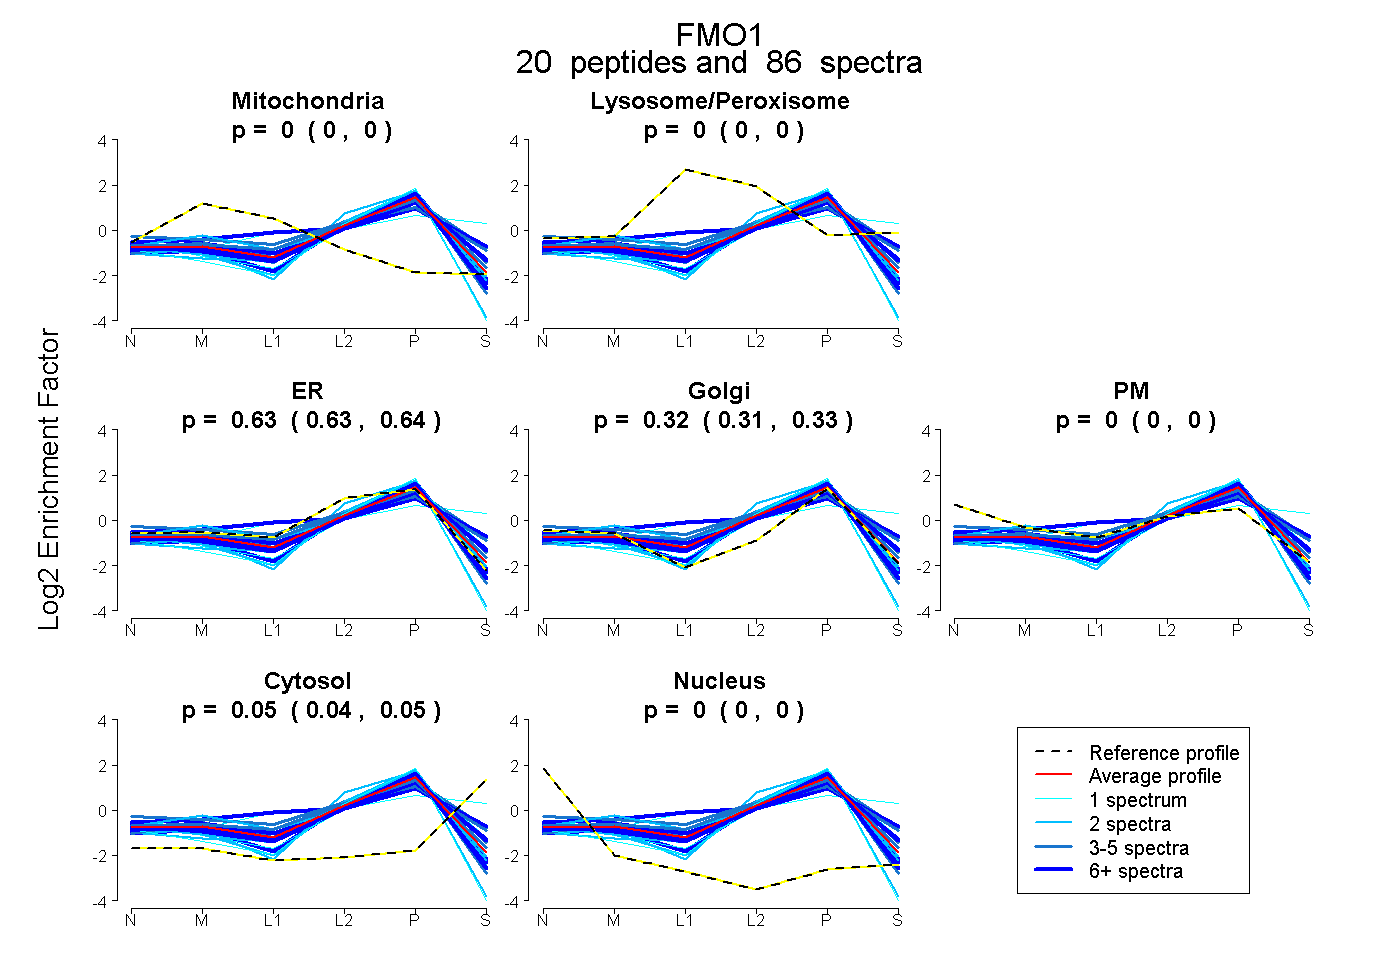 |
0.000 0.000 | 0.000 |
0.000 0.000 | 0.000 |
0.634 0.627 | 0.640 |
0.318 0.308 | 0.327 |
0.000 0.000 | 0.000 |
0.048 0.042 | 0.053 |
0.000 0.000 | 0.000 |
|||
| Plot | Lyso | Other | |||||||||||
| Expt C |
23 peptides |
197 spectra |
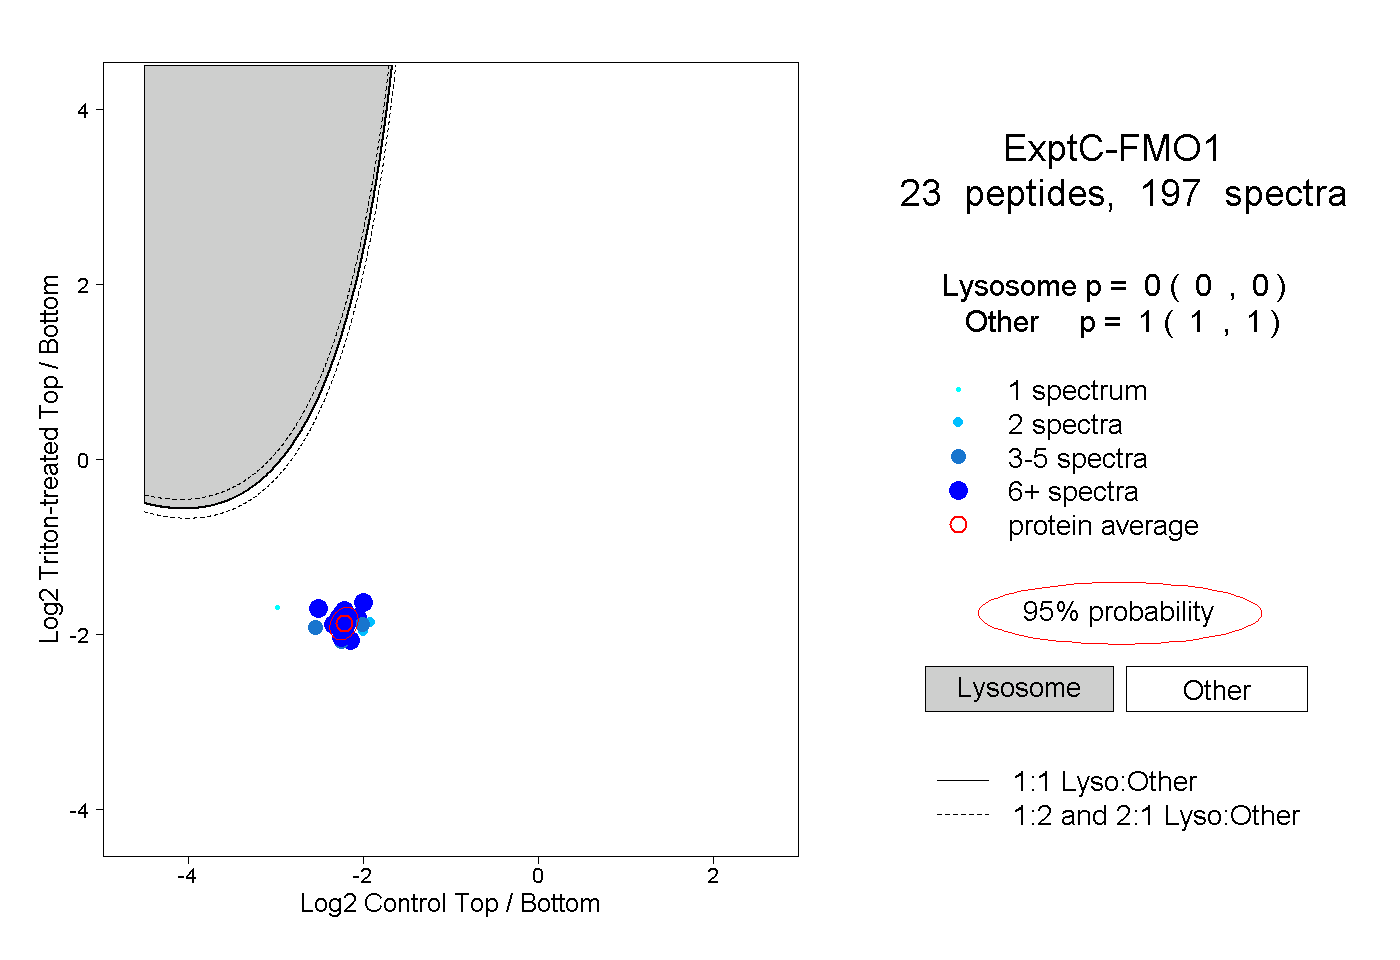 |
0.000 0.000 | 0.000 |
1.000 1.000 | 1.000 |
||||||||
| Plot | Lyso | Other | |||||||||||
| Expt D |
12 peptides |
23 spectra |
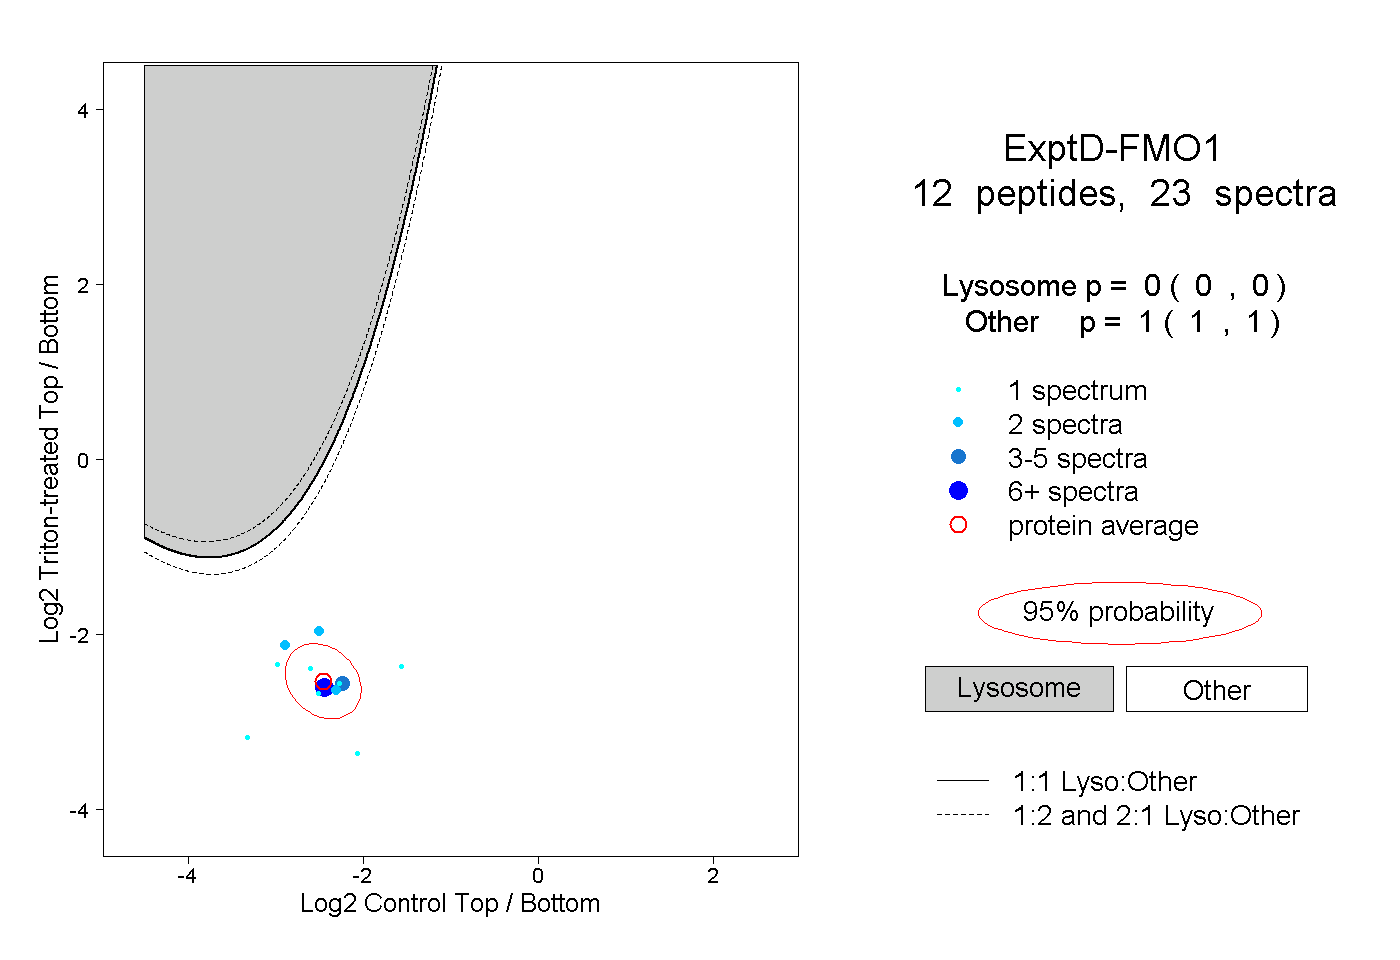 |
0.000 0.000 | 0.000 |
1.000 1.000 | 1.000 |