 9
9peptides
spectra
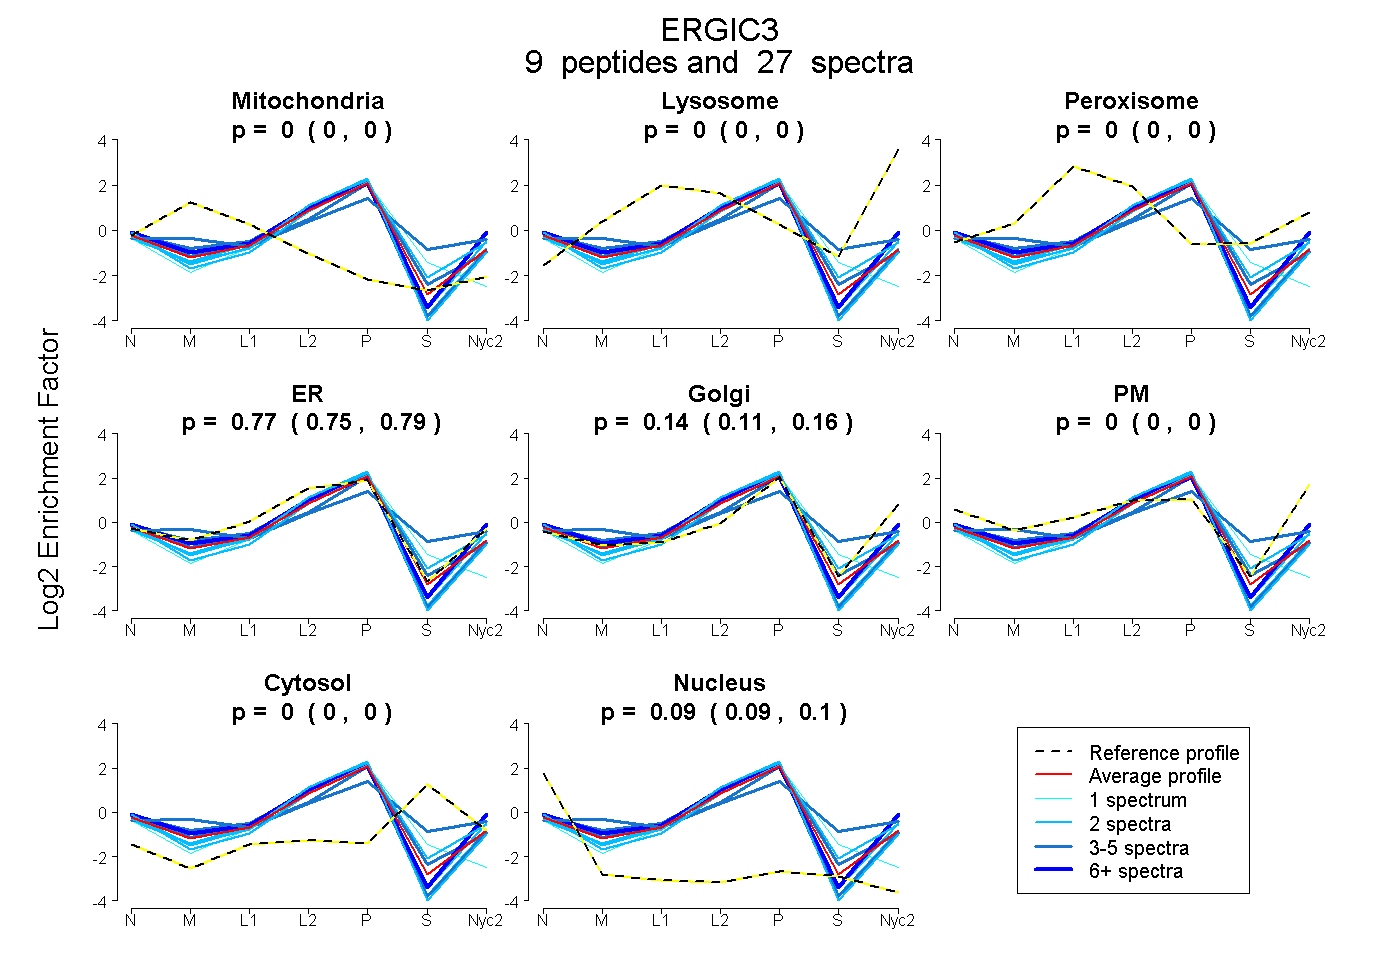
0.000 | 0.000
0.000 | 0.000
0.000 | 0.000
0.745 | 0.791
0.106 | 0.162
0.000 | 0.000
0.000 | 0.000
0.086 | 0.100
4peptides
spectra
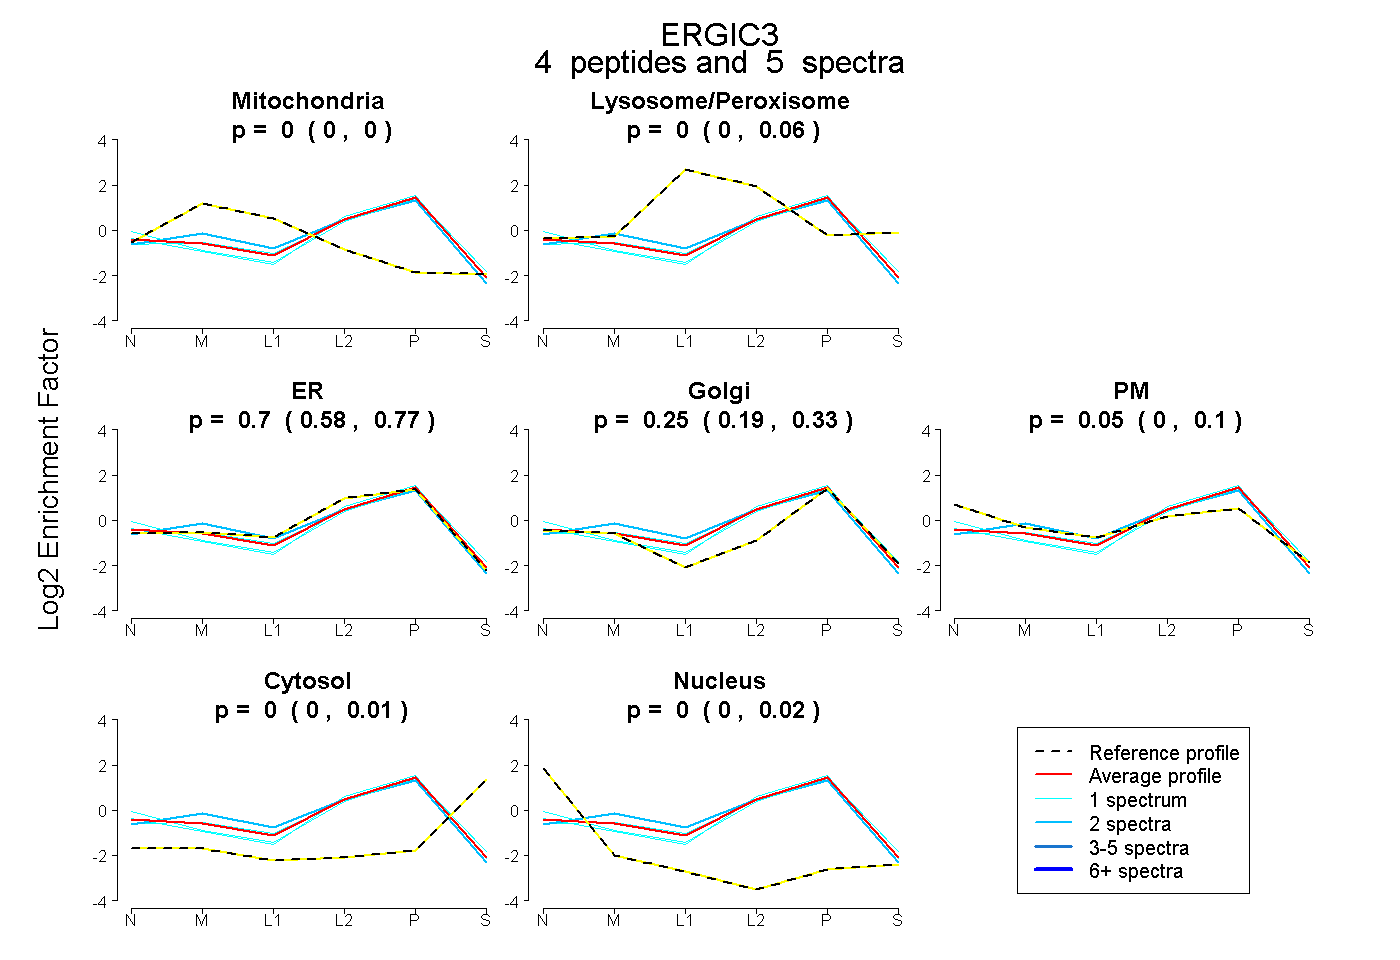
0.000 | 0.000
0.000 | 0.056
0.580 | 0.765
0.187 | 0.327
0.000 | 0.097
0.000 | 0.011
0.000 | 0.015
8peptides
spectra
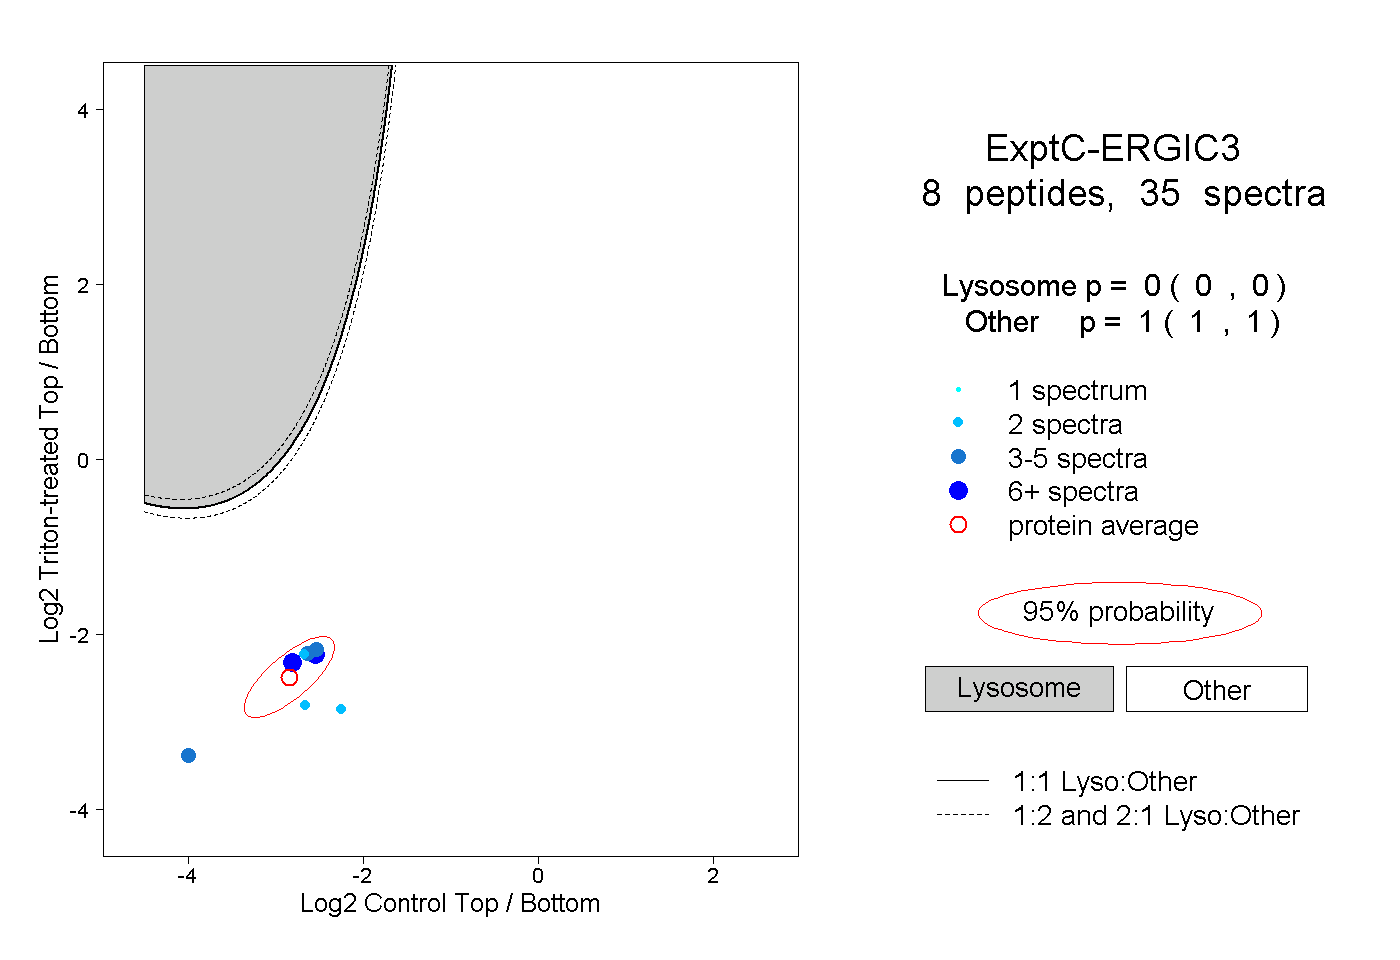
0.000 | 0.000
1.000 | 1.000
4peptides
spectra
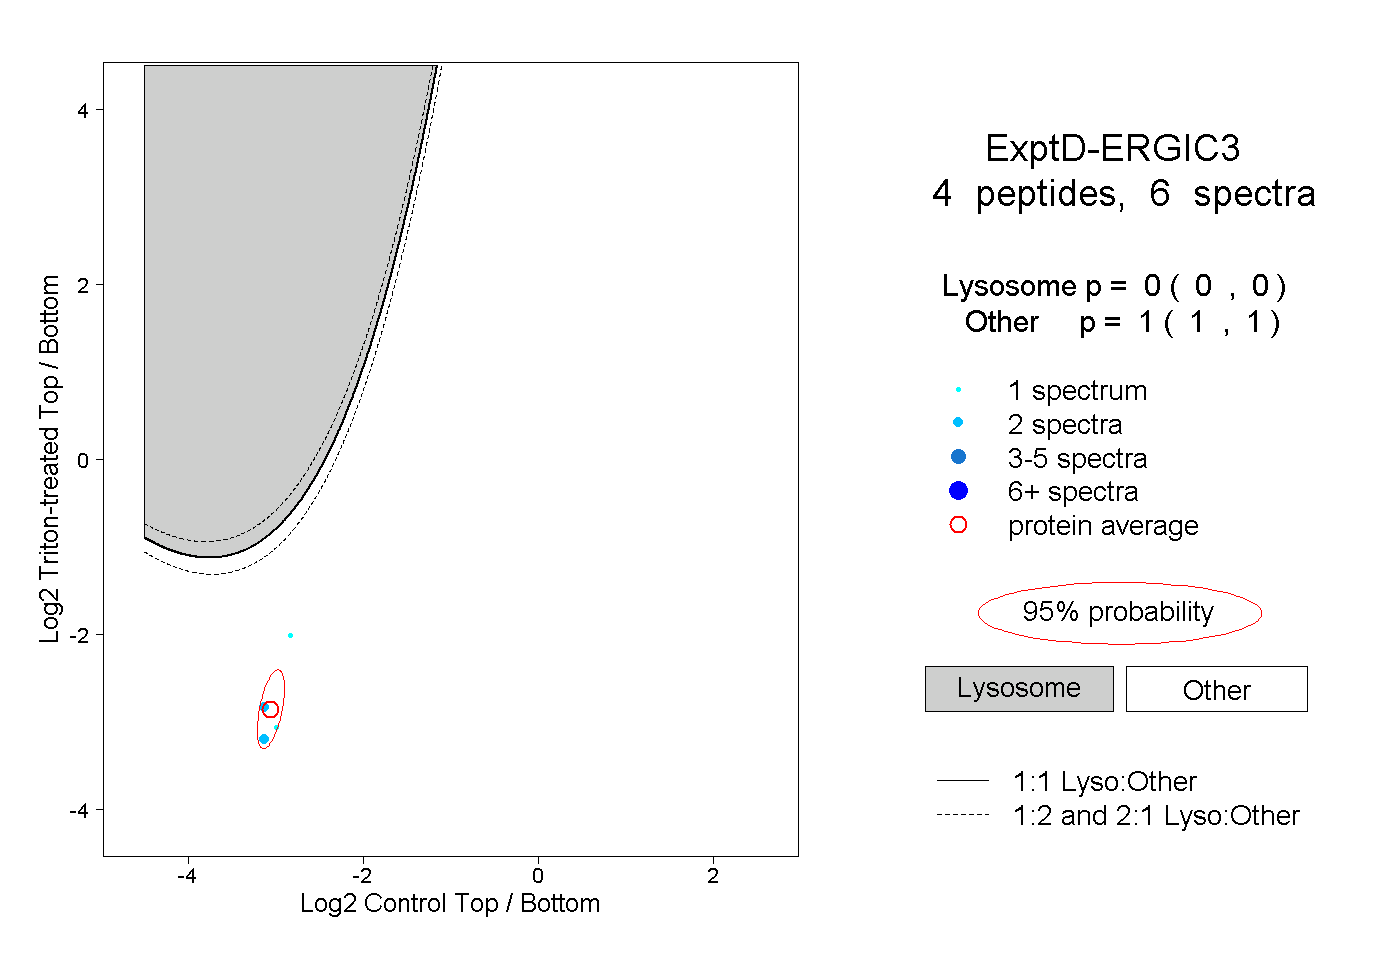
0.000 | 0.000
1.000 | 1.000