 9
9peptides
spectra
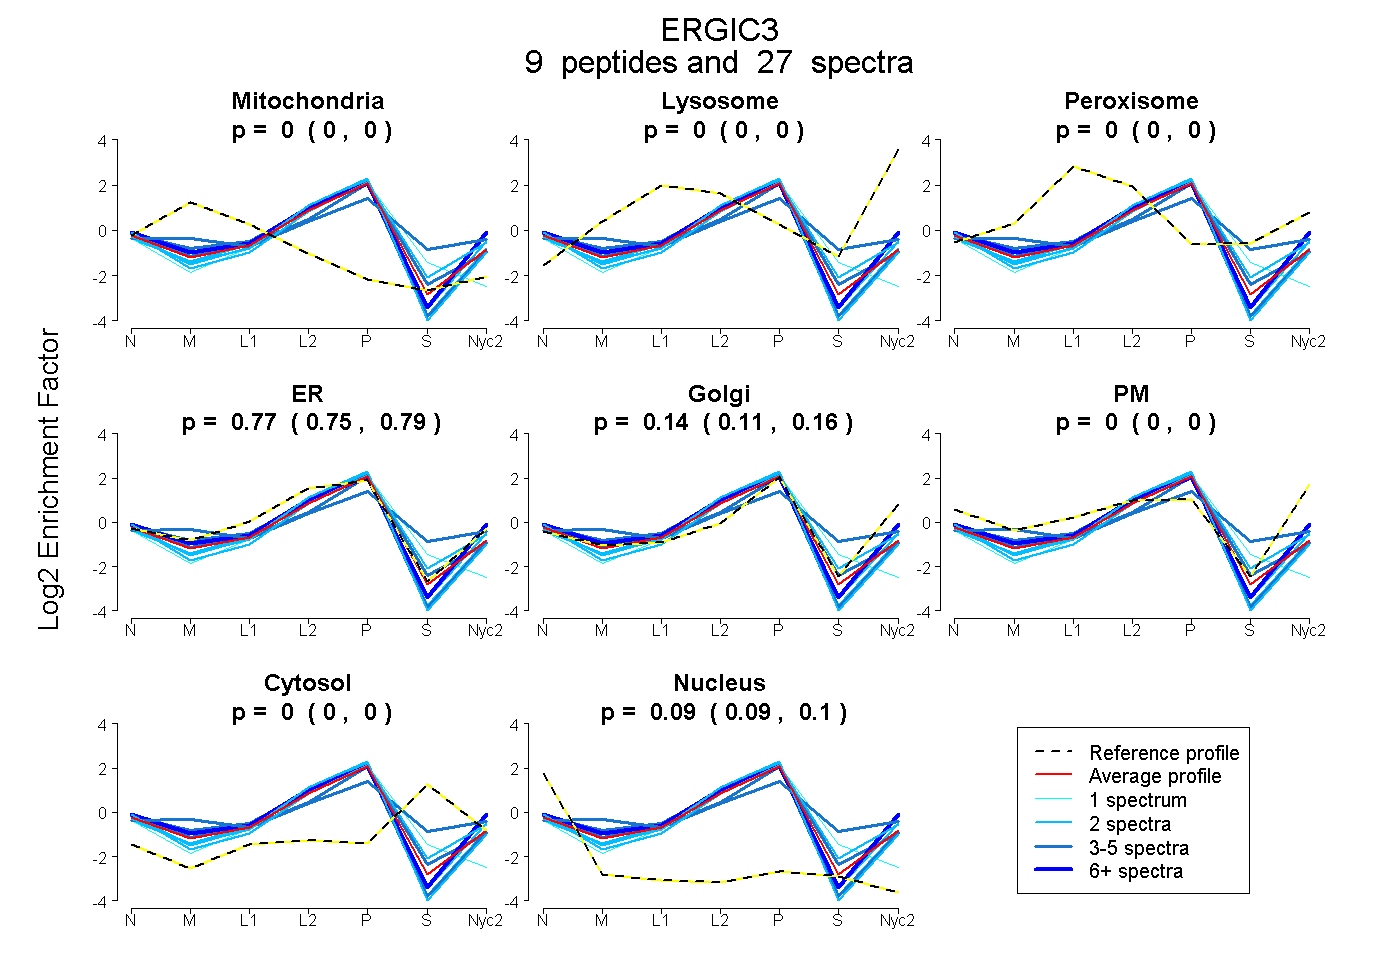
0.000 | 0.000
0.000 | 0.000
0.000 | 0.000
0.745 | 0.791
0.106 | 0.162
0.000 | 0.000
0.000 | 0.000
0.086 | 0.100
| Plot | Mito | Lyso | Perox | ER | Golgi | PM | Cytosol | Nucleus | |||||
| Expt A |
9 peptides |
27 spectra |
|
0.000 0.000 | 0.000 |
0.000 0.000 | 0.000 |
0.000 0.000 | 0.000 |
0.770 0.745 | 0.791 |
0.136 0.106 | 0.162 |
0.000 0.000 | 0.000 |
0.000 0.000 | 0.000 |
0.094 0.086 | 0.100 |
| 2 spectra, DGIPVSSEAER | 0.000 | 0.000 | 0.000 | 0.749 | 0.201 | 0.000 | 0.000 | 0.050 | ||
| 6 spectra, TNQFSVTR | 0.000 | 0.000 | 0.000 | 0.693 | 0.274 | 0.000 | 0.000 | 0.033 | ||
| 4 spectra, QFDAYPK | 0.000 | 0.000 | 0.000 | 0.667 | 0.217 | 0.000 | 0.000 | 0.116 | ||
| 4 spectra, VAGNFHFAPGK | 0.035 | 0.000 | 0.043 | 0.433 | 0.249 | 0.000 | 0.240 | 0.000 | ||
| 4 spectra, TLEDFR | 0.000 | 0.000 | 0.000 | 0.912 | 0.000 | 0.000 | 0.000 | 0.088 | ||
| 2 spectra, VEVTVFDPDSLDPNR | 0.000 | 0.000 | 0.000 | 0.590 | 0.287 | 0.000 | 0.064 | 0.060 | ||
| 1 spectrum, NEGCQVYGFLEVNK | 0.000 | 0.000 | 0.000 | 0.748 | 0.000 | 0.000 | 0.146 | 0.106 | ||
| 2 spectra, VDGEVLR | 0.000 | 0.000 | 0.000 | 0.904 | 0.000 | 0.000 | 0.000 | 0.096 | ||
| 2 spectra, NPDTIEQCR | 0.000 | 0.000 | 0.000 | 0.805 | 0.098 | 0.000 | 0.000 | 0.098 |
| Plot | Mito | Lyso or Perox | ER | Golgi | PM | Cytosol | Nucleus | ||||||
| Expt B |
4 peptides |
5 spectra |
 |
0.000 0.000 | 0.000 |
0.000 0.000 | 0.056 |
0.698 0.580 | 0.765 |
0.252 0.187 | 0.327 |
0.050 0.000 | 0.097 |
0.000 0.000 | 0.011 |
0.000 0.000 | 0.015 |
|||
| Plot | Lyso | Other | |||||||||||
| Expt C |
8 peptides |
35 spectra |
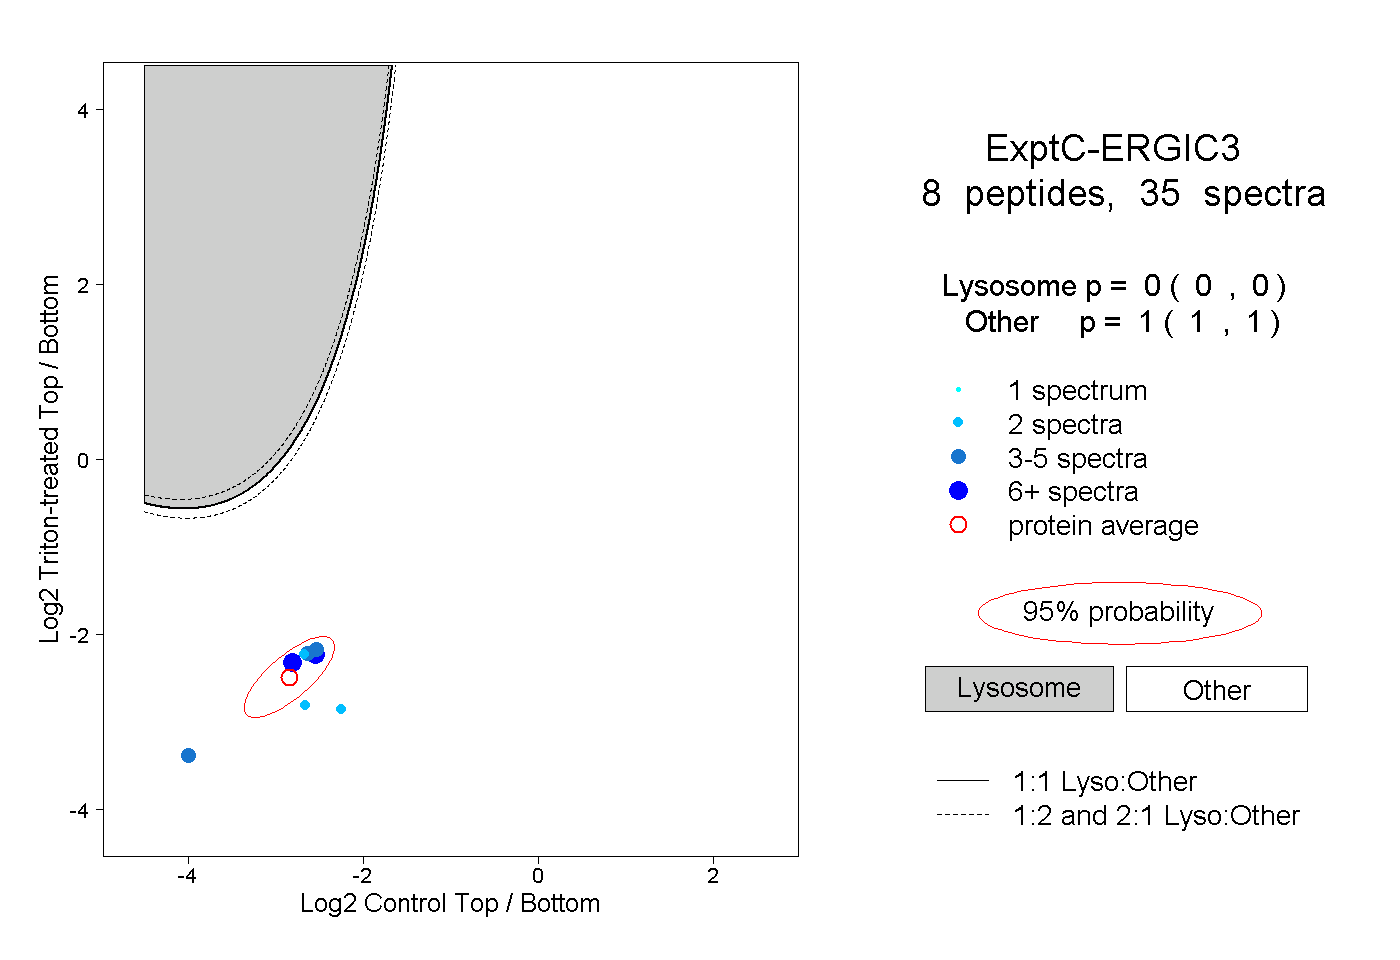 |
0.000 0.000 | 0.000 |
1.000 1.000 | 1.000 |
||||||||
| Plot | Lyso | Other | |||||||||||
| Expt D |
4 peptides |
6 spectra |
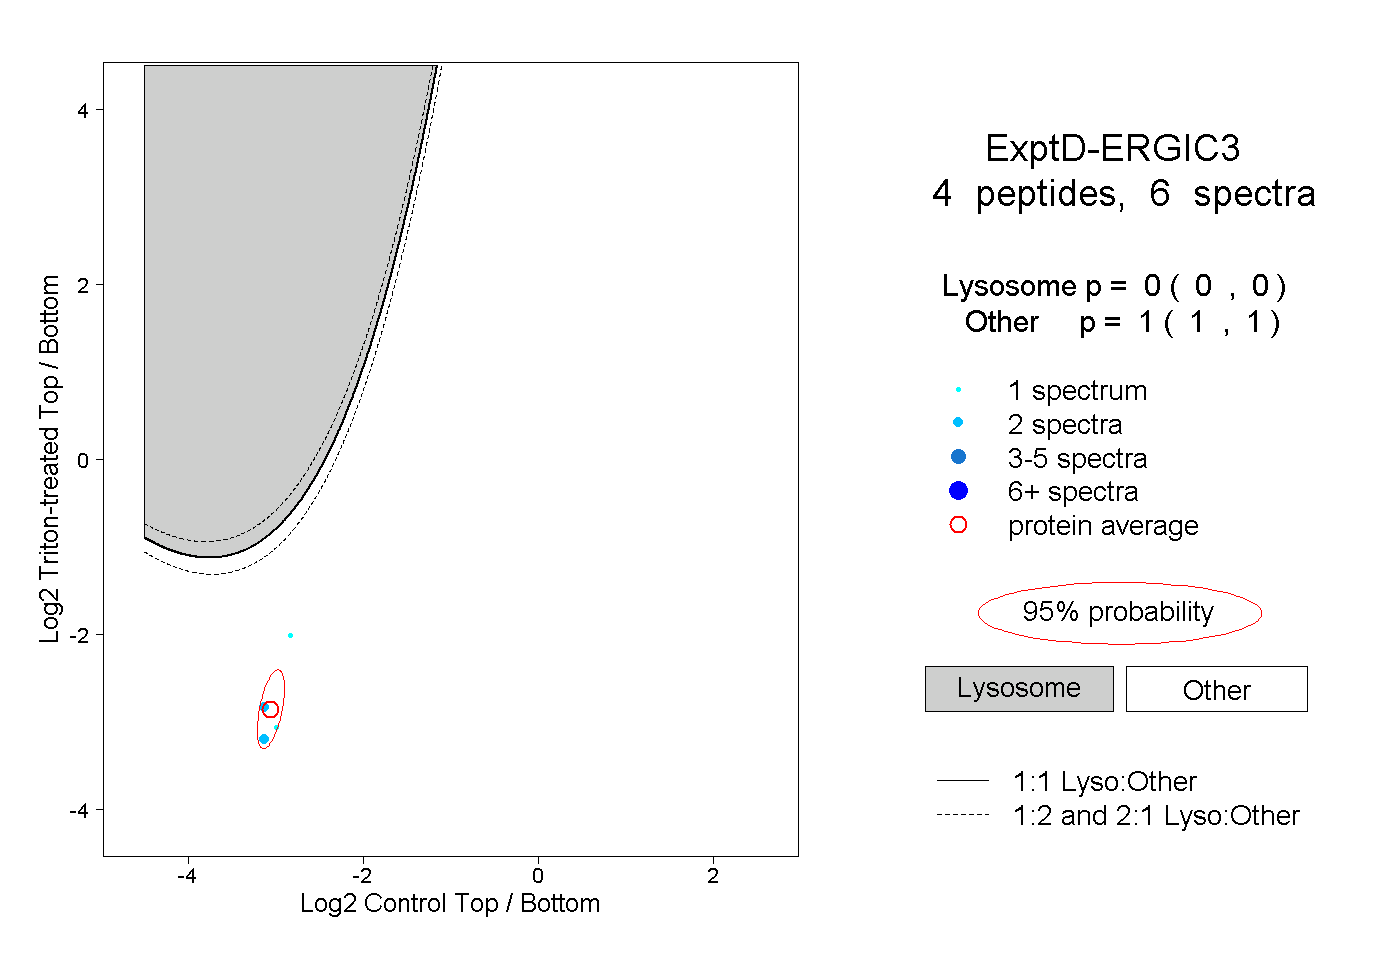 |
0.000 0.000 | 0.000 |
1.000 1.000 | 1.000 |