 13
13peptides
spectra
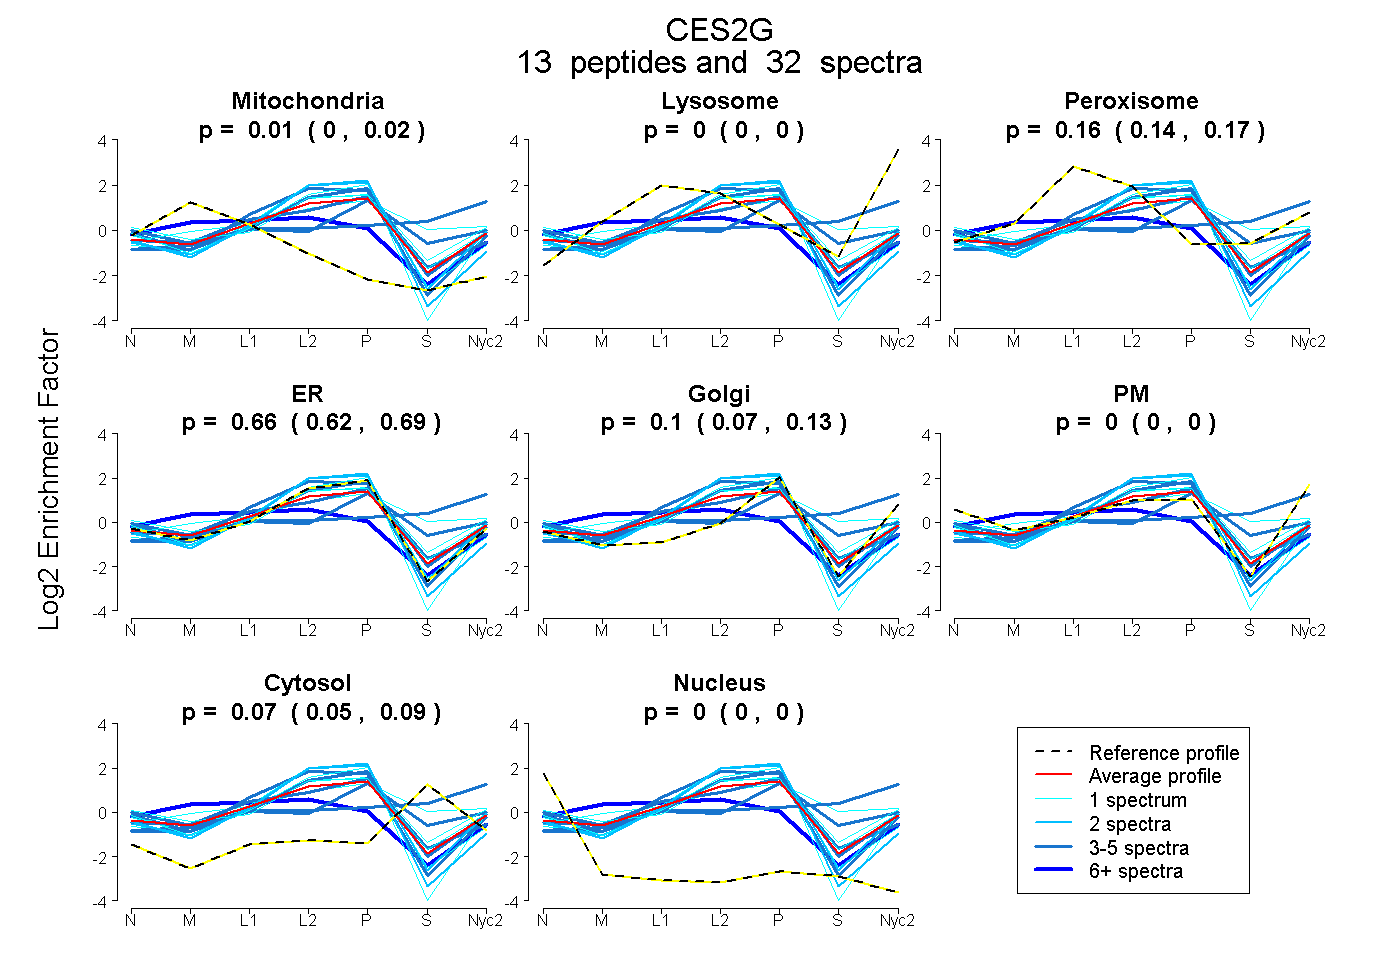
0.000 | 0.023
0.000 | 0.000
0.145 | 0.173
0.621 | 0.691
0.068 | 0.132
0.000 | 0.000
0.054 | 0.085
0.000 | 0.000
3peptides
spectra
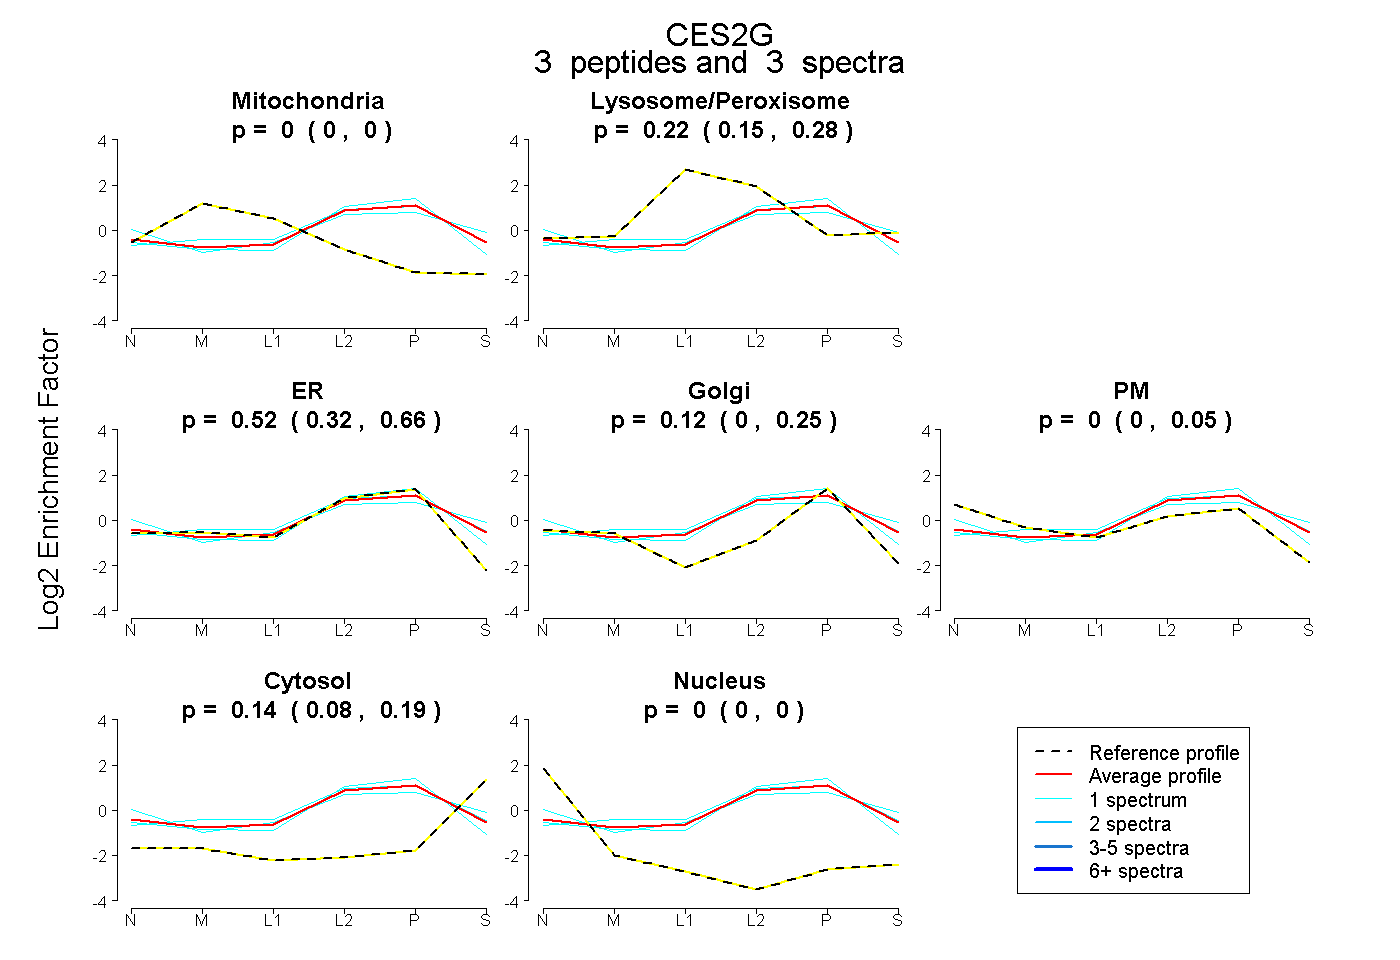
0.000 | 0.000
0.153 | 0.285
0.319 | 0.658
0.000 | 0.252
0.000 | 0.050
0.078 | 0.188
0.000 | 0.000
8peptides
spectra
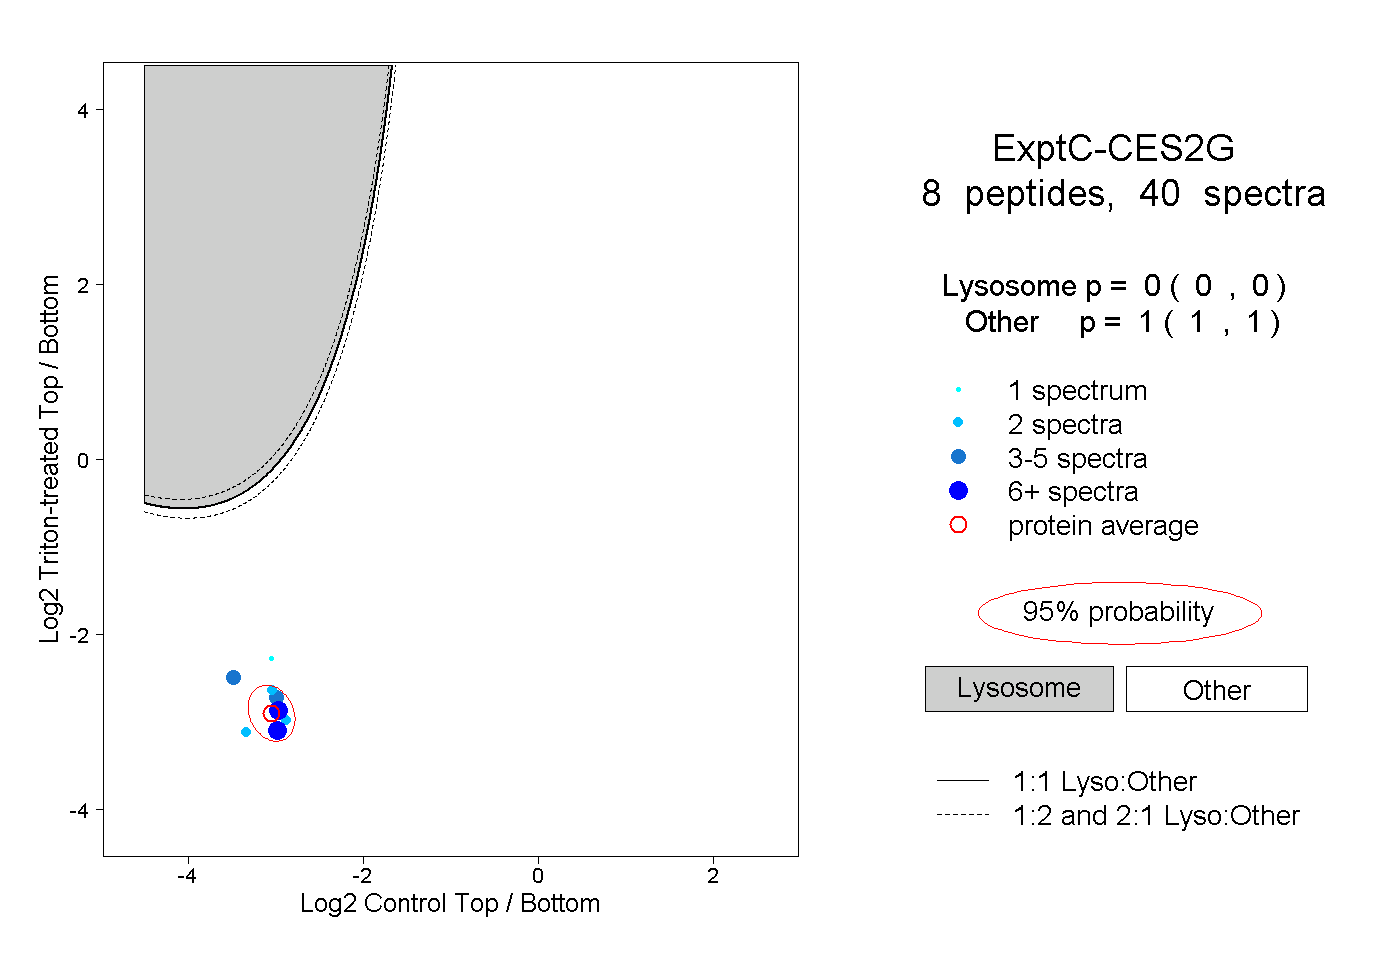
0.000 | 0.000
1.000 | 1.000
1peptide
spectrum
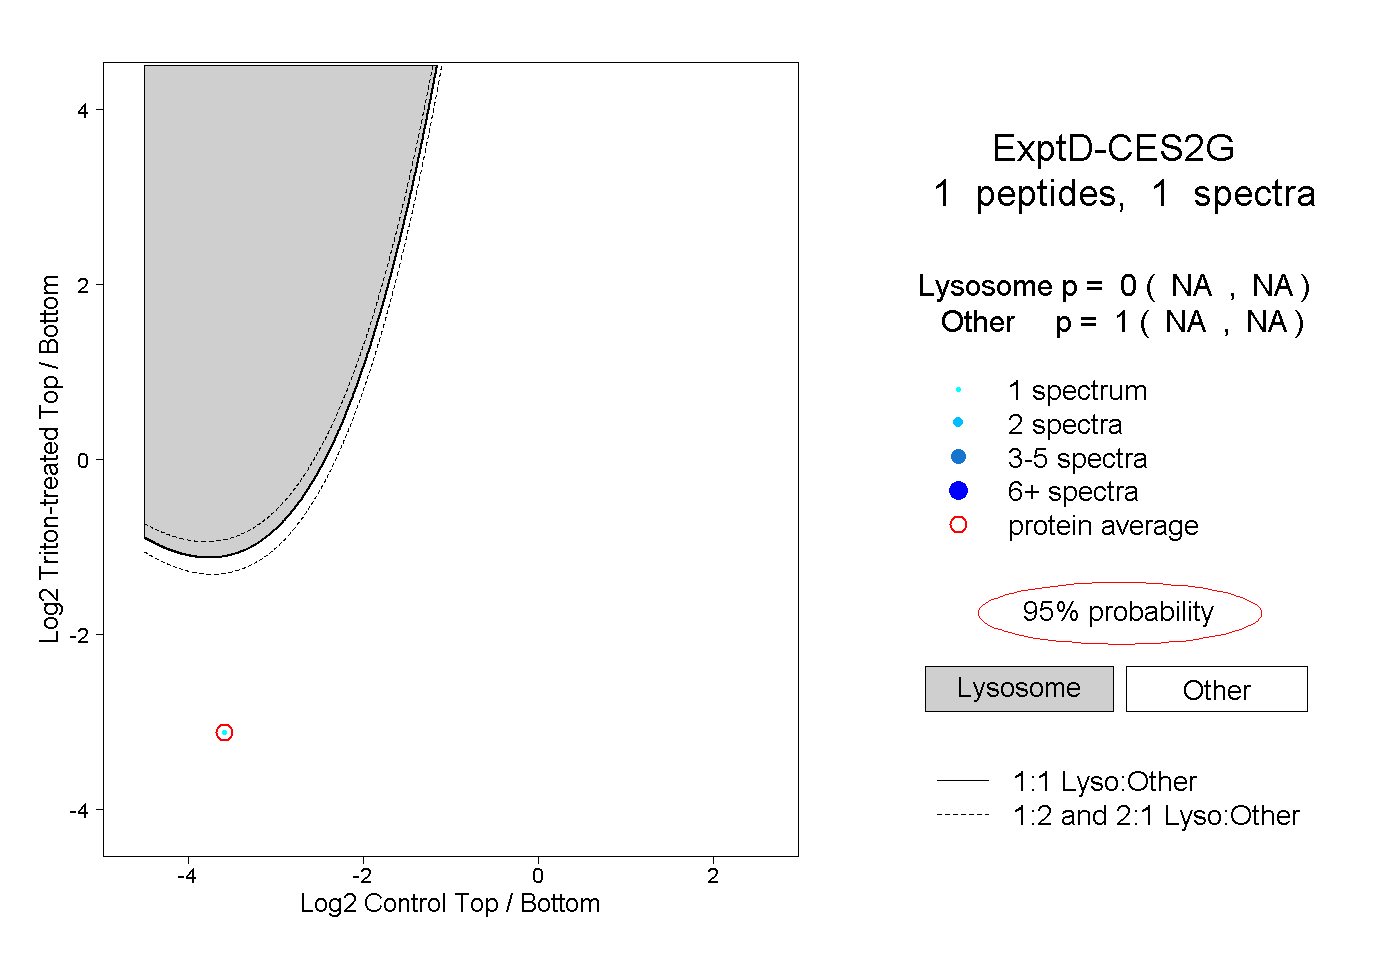
NA | NA
NA | NA