 13
13peptides
spectra
0.000 | 0.023
0.000 | 0.000
0.145 | 0.173
0.621 | 0.691
0.068 | 0.132
0.000 | 0.000
0.054 | 0.085
0.000 | 0.000
| Plot | Mito | Lyso | Perox | ER | Golgi | PM | Cytosol | Nucleus | |||||
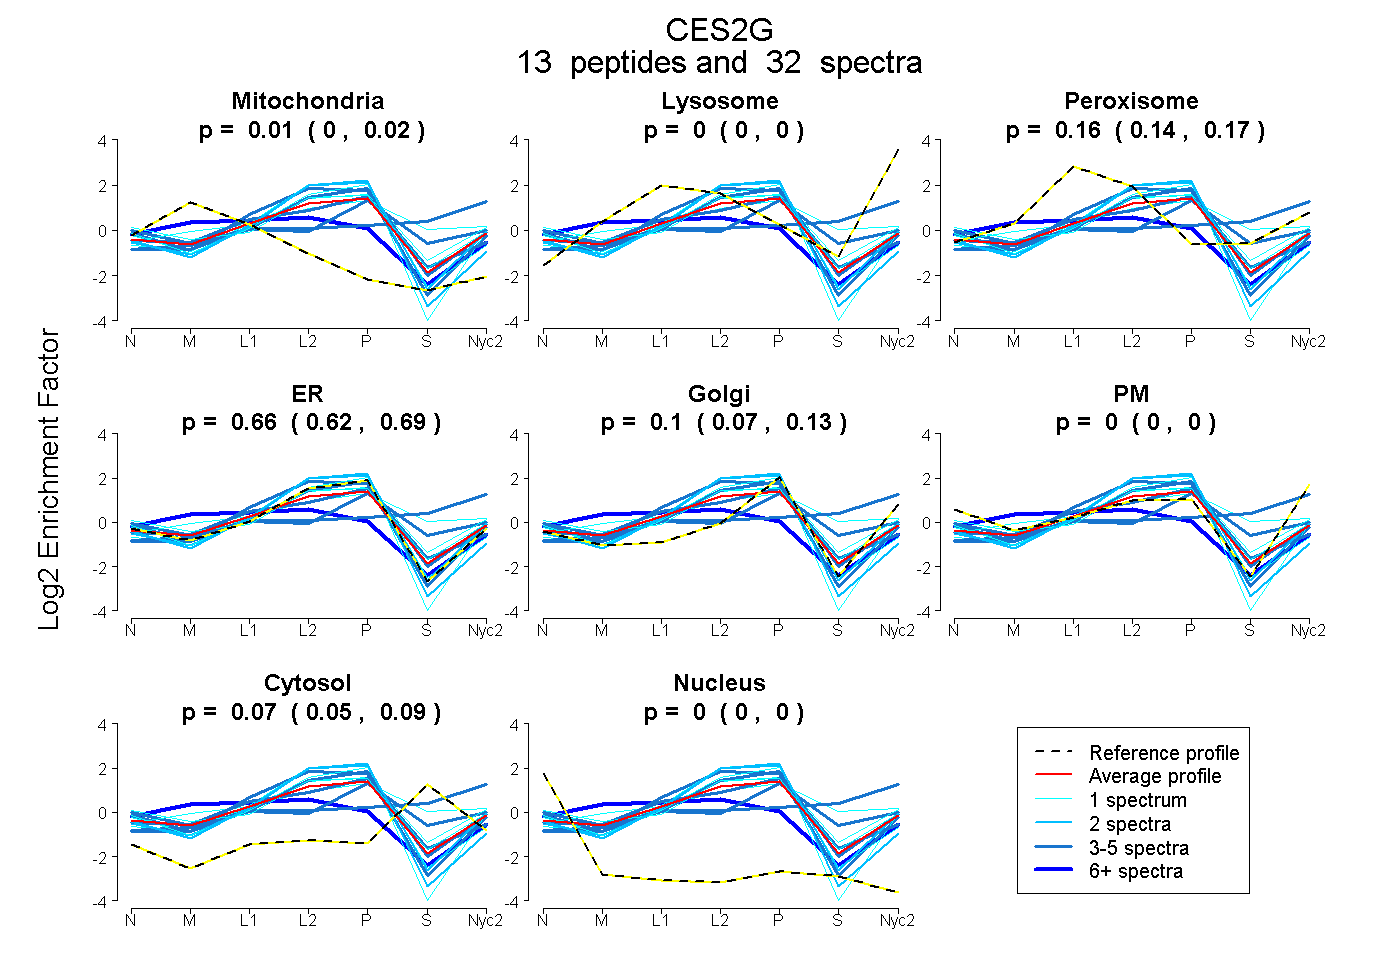
| Expt A |
13 peptides |
32 spectra |
|
0.007 0.000 | 0.023 |
0.000 0.000 | 0.000 |
0.160 0.145 | 0.173 |
0.659 0.621 | 0.691 |
0.102 0.068 | 0.132 |
0.000 0.000 | 0.000 |
0.072 0.054 | 0.085 |
0.000 0.000 | 0.000 |
| 1 spectrum, LSGCEAMDPESLVHCLR | 0.000 | 0.052 | 0.204 | 0.568 | 0.125 | 0.000 | 0.051 | 0.000 | ||
| 4 spectra, MNMEGLK | 0.000 | 0.087 | 0.000 | 0.844 | 0.000 | 0.000 | 0.069 | 0.000 | ||
| 2 spectra, VIGSAQTIK | 0.000 | 0.024 | 0.000 | 0.976 | 0.000 | 0.000 | 0.000 | 0.000 | ||
| 1 spectrum, SQNMHK | 0.000 | 0.000 | 0.076 | 0.683 | 0.000 | 0.160 | 0.081 | 0.000 | ||
| 3 spectra, DGTSQSNICPQNVR | 0.000 | 0.000 | 0.083 | 0.917 | 0.000 | 0.000 | 0.000 | 0.000 | ||
| 1 spectrum, ENLQAFLK | 0.000 | 0.000 | 0.000 | 1.000 | 0.000 | 0.000 | 0.000 | 0.000 | ||
| 3 spectra, LEEIK | 0.000 | 0.380 | 0.015 | 0.000 | 0.079 | 0.079 | 0.447 | 0.000 | ||
| 1 spectrum, SEEQITVISK | 0.000 | 0.000 | 0.000 | 0.983 | 0.000 | 0.000 | 0.000 | 0.017 | ||
| 1 spectrum, ADHGDEVPFVFGSFFWGMK | 0.000 | 0.126 | 0.142 | 0.437 | 0.000 | 0.000 | 0.294 | 0.000 | ||
| 7 spectra, APVGPLR | 0.377 | 0.015 | 0.100 | 0.381 | 0.000 | 0.128 | 0.000 | 0.000 | ||
| 3 spectra, LGVLGFFSTGDHHAR | 0.000 | 0.000 | 0.231 | 0.070 | 0.488 | 0.000 | 0.211 | 0.000 | ||
| 3 spectra, SGVHTFLGIPFAK | 0.037 | 0.000 | 0.134 | 0.708 | 0.014 | 0.000 | 0.107 | 0.000 | ||
| 2 spectra, NTHTGQVQGK | 0.000 | 0.000 | 0.000 | 1.000 | 0.000 | 0.000 | 0.000 | 0.000 |
| Plot | Mito | Lyso or Perox | ER | Golgi | PM | Cytosol | Nucleus | ||||||
| Expt B |
3 peptides |
3 spectra |
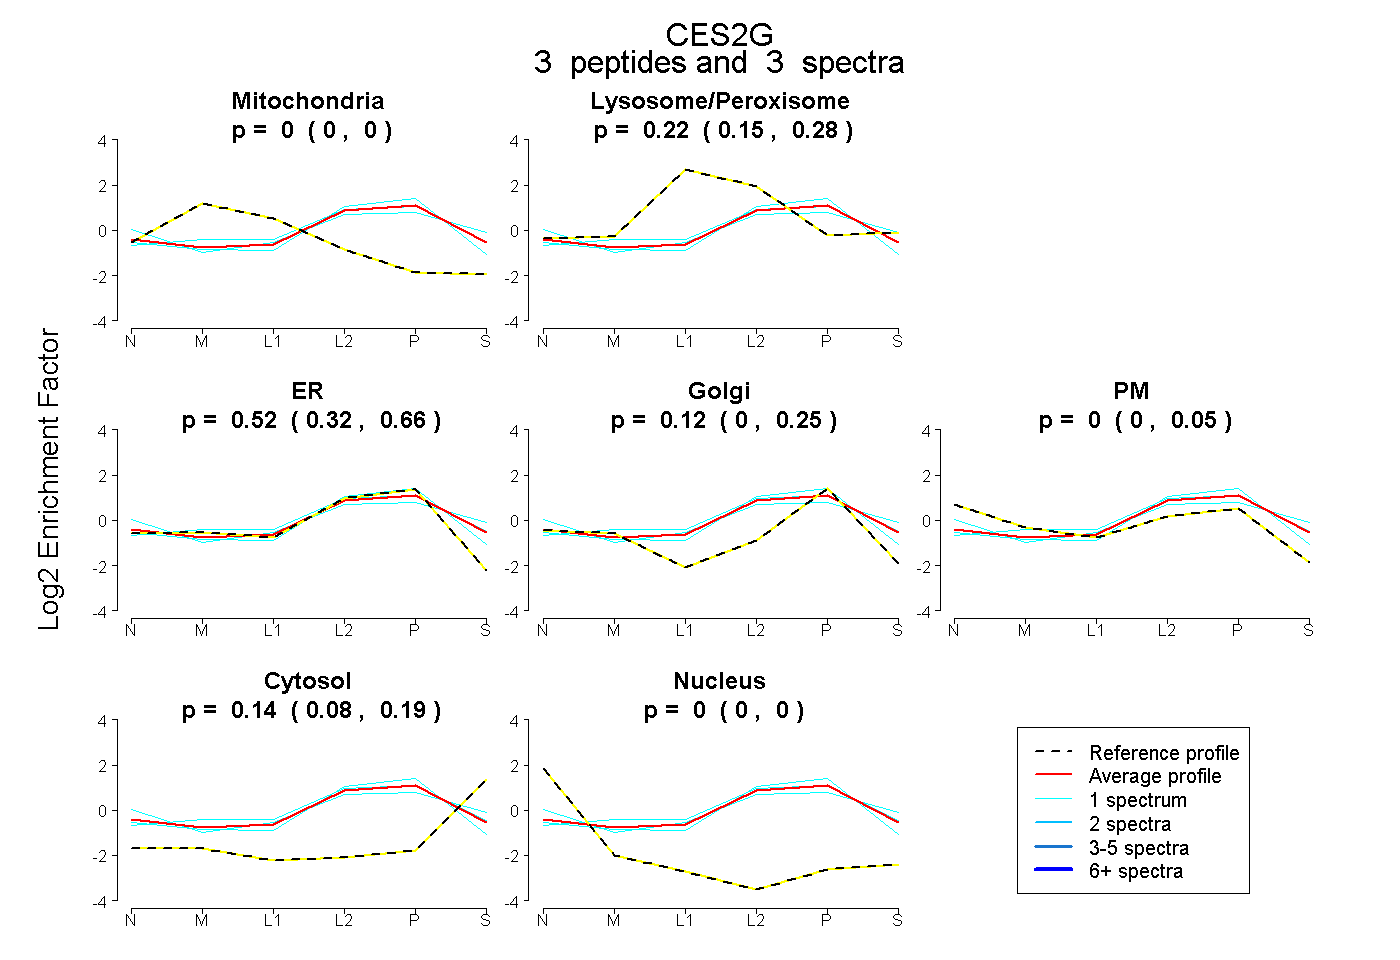 |
0.000 0.000 | 0.000 |
0.224 0.153 | 0.285 |
0.523 0.319 | 0.658 |
0.115 0.000 | 0.252 |
0.000 0.000 | 0.050 |
0.139 0.078 | 0.188 |
0.000 0.000 | 0.000 |
|||
| Plot | Lyso | Other | |||||||||||
| Expt C |
8 peptides |
40 spectra |
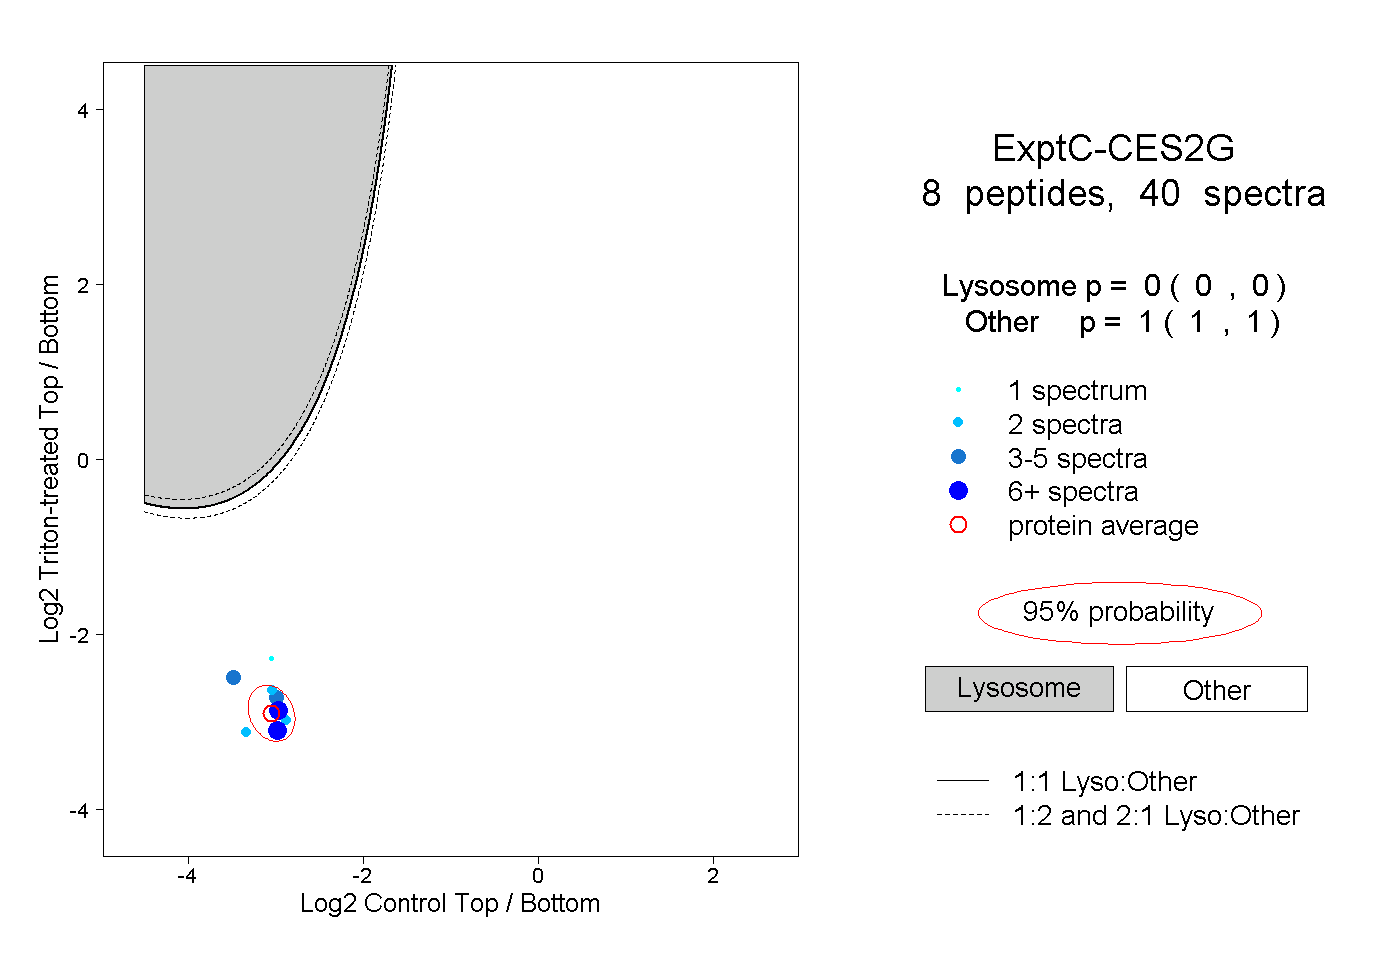 |
0.000 0.000 | 0.000 |
1.000 1.000 | 1.000 |
||||||||
| Plot | Lyso | Other | |||||||||||
| Expt D |
1 peptide |
1 spectrum |
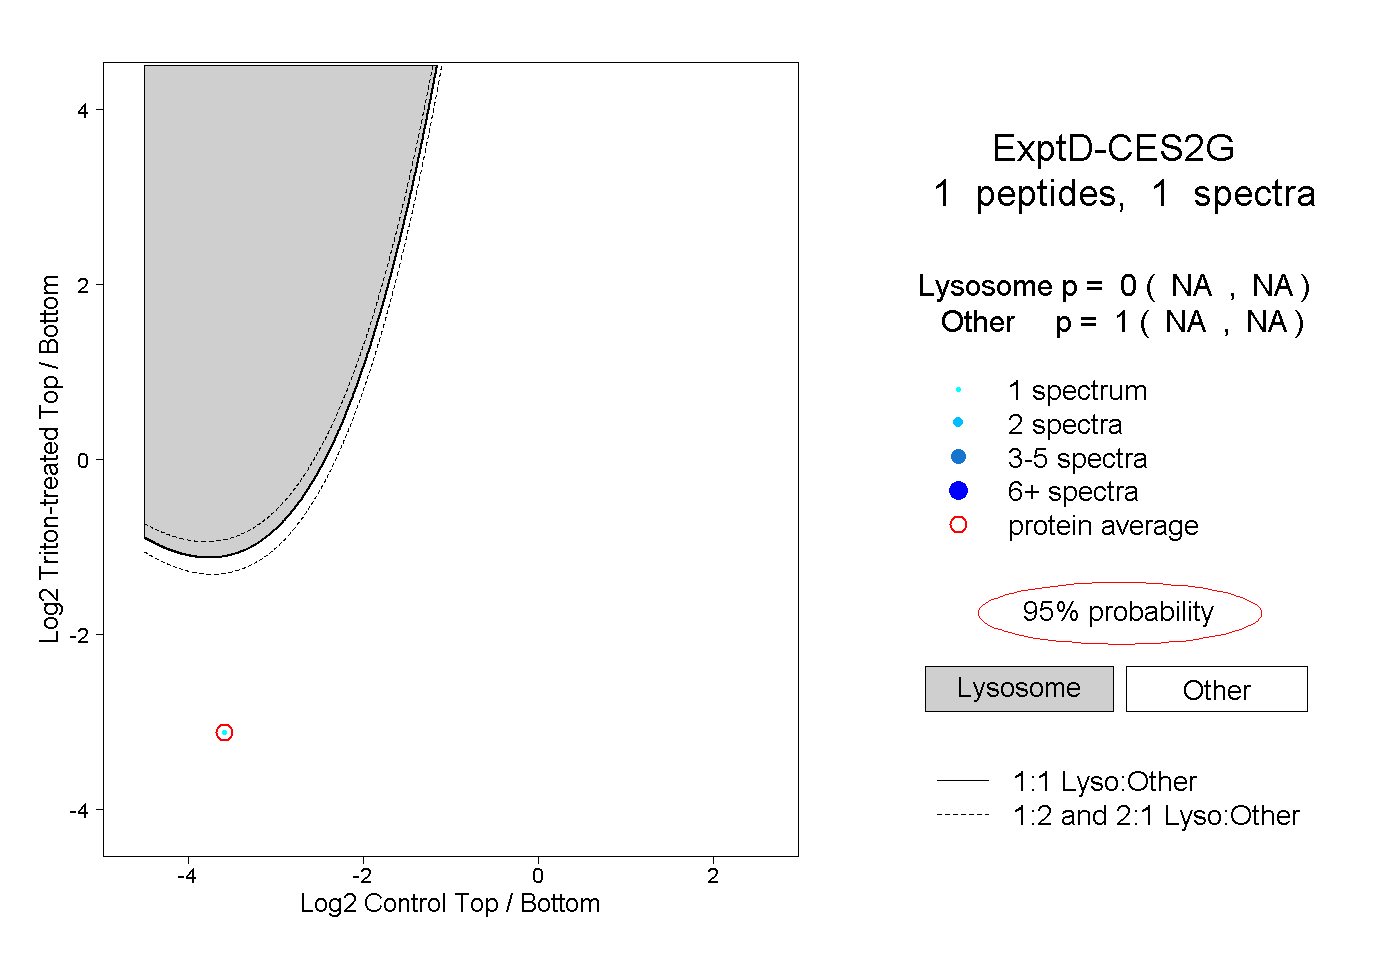 |
0.000 NA | NA |
1.000 NA | NA |