 10
10peptides
spectra
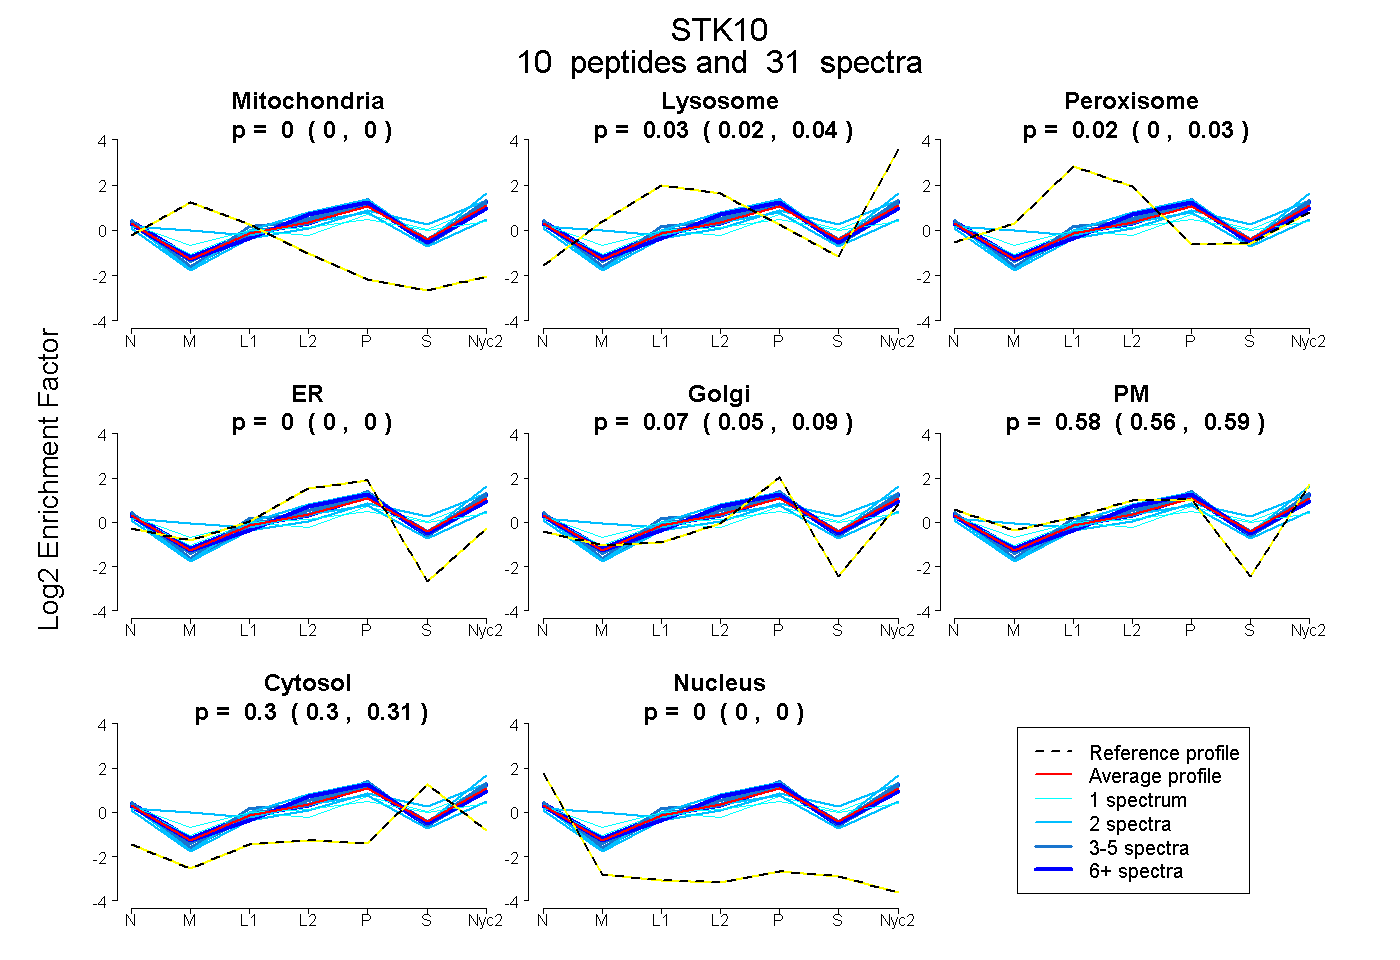
0.000 | 0.000
0.019 | 0.039
0.002 | 0.027
0.000 | 0.000
0.055 | 0.088
0.562 | 0.594
0.295 | 0.310
0.000 | 0.000
2peptides
spectra
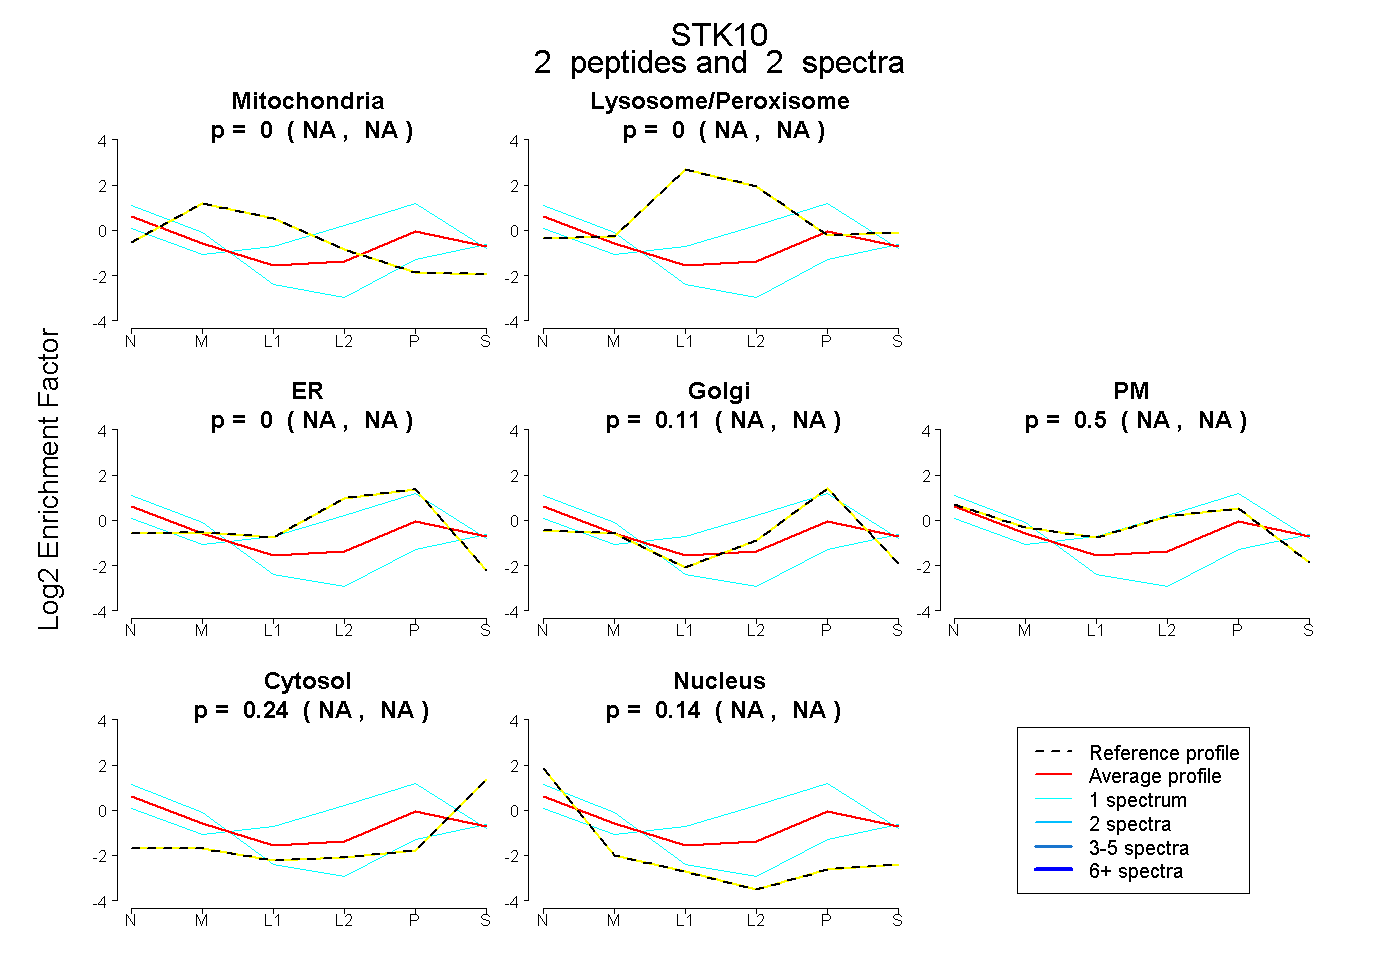
NA | NA
NA | NA
NA | NA
NA | NA
NA | NA
NA | NA
NA | NA
13peptides
spectra
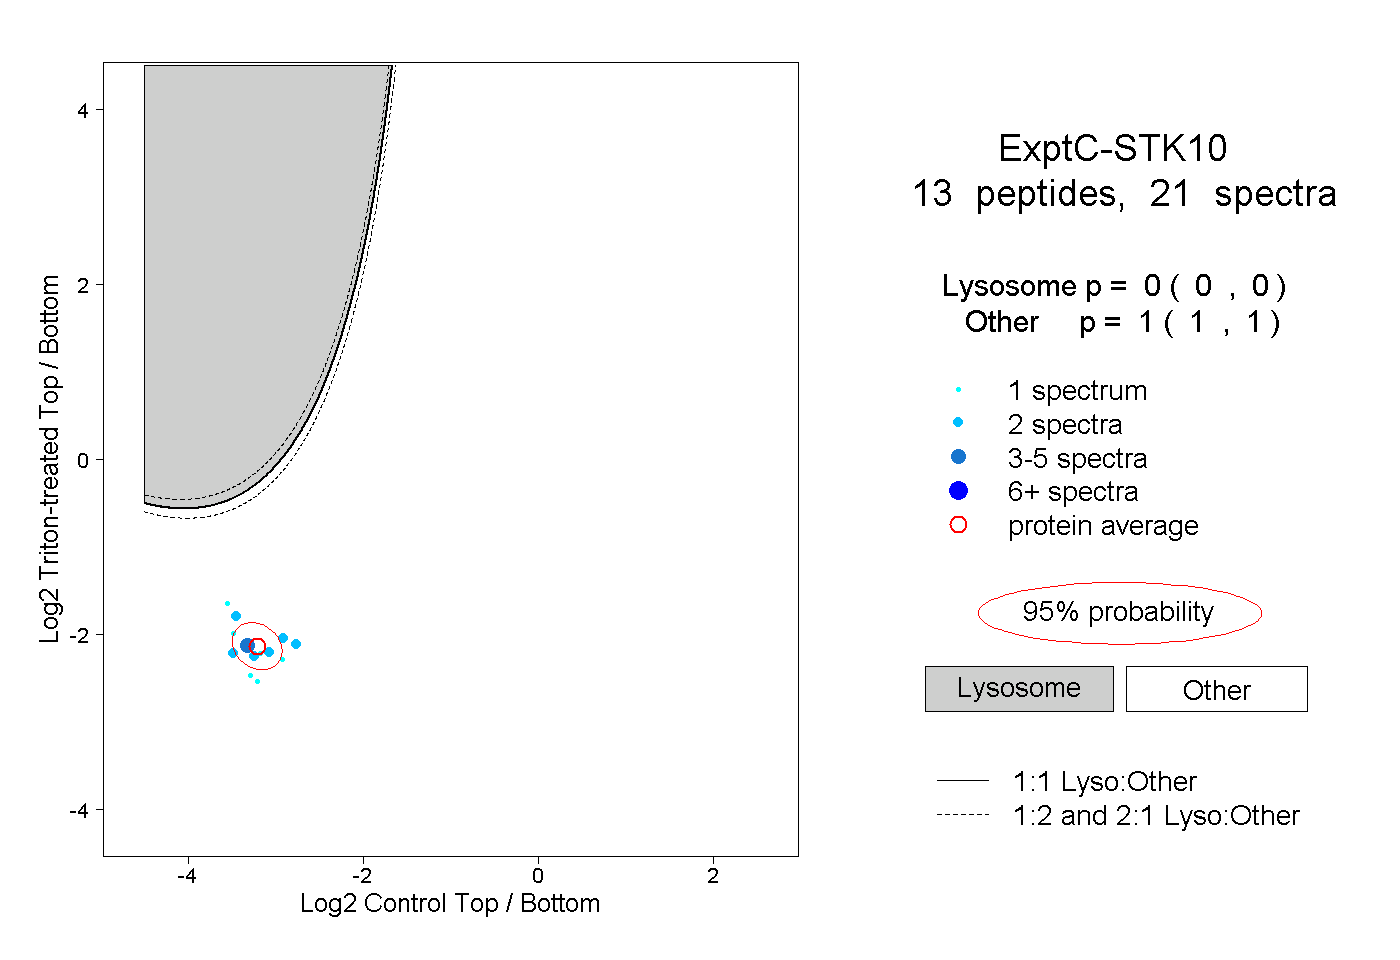
0.000 | 0.000
1.000 | 1.000
2peptides
spectra
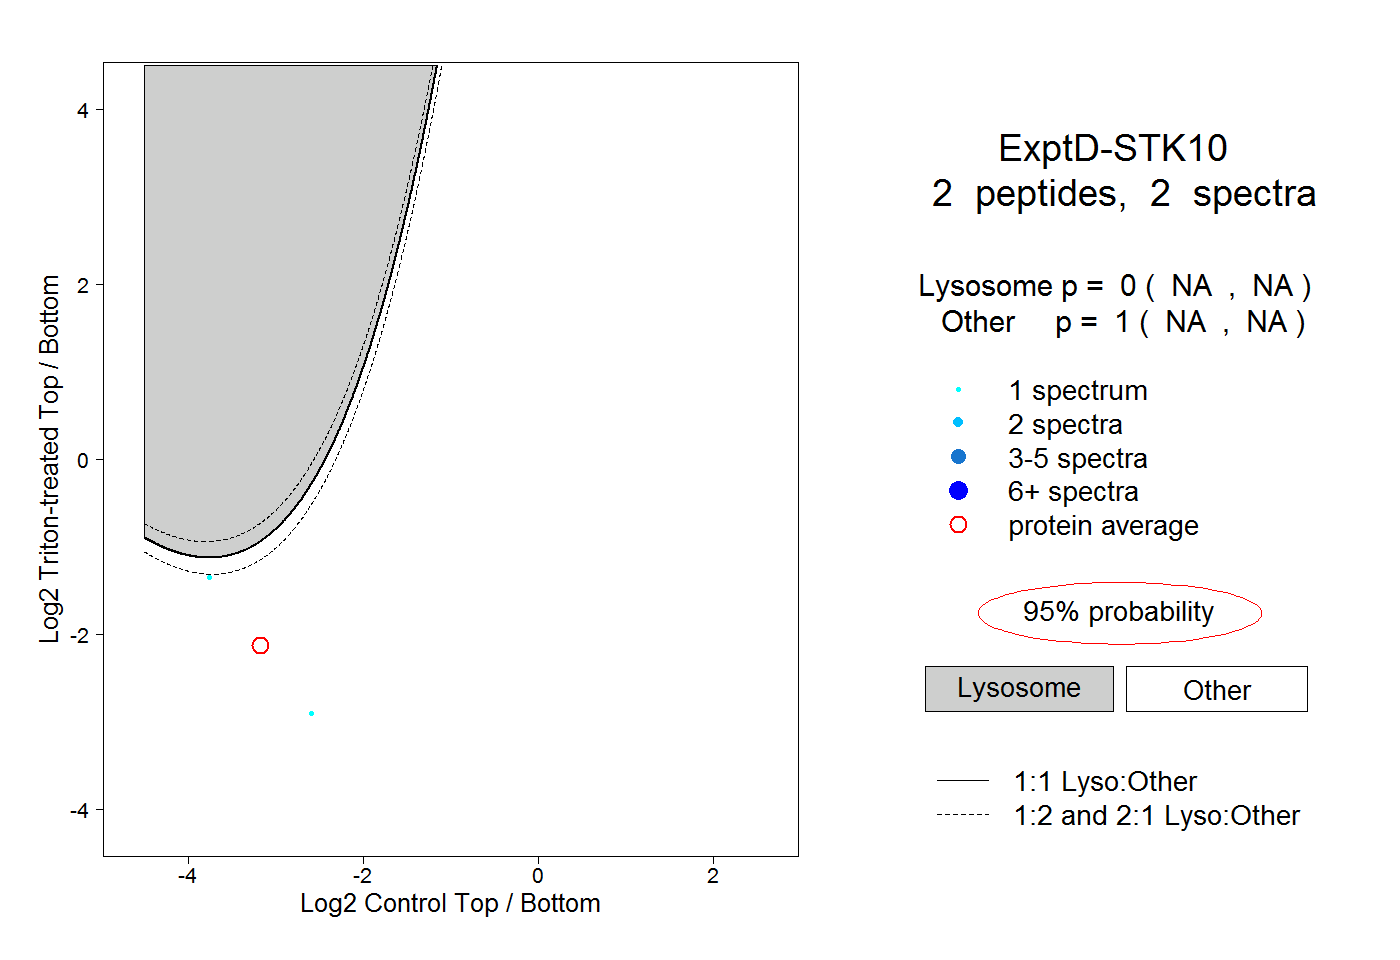
NA | NA
NA | NA