 10
10peptides
spectra
0.000 | 0.000
0.019 | 0.039
0.002 | 0.027
0.000 | 0.000
0.055 | 0.088
0.562 | 0.594
0.295 | 0.310
0.000 | 0.000
| Plot | Mito | Lyso | Perox | ER | Golgi | PM | Cytosol | Nucleus | |||||
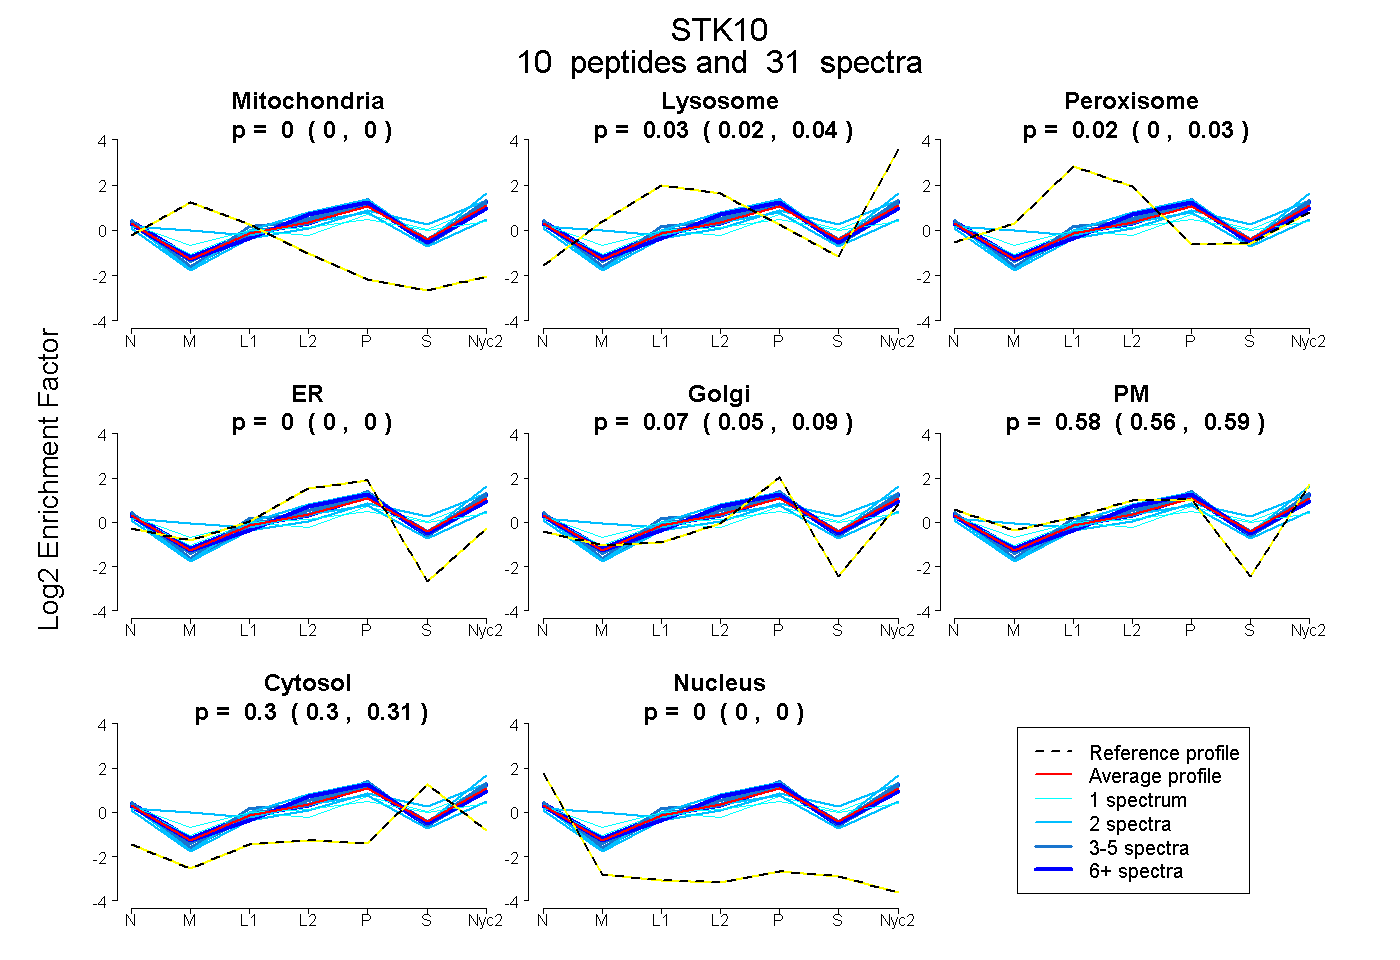
| Expt A |
10 peptides |
31 spectra |
|
0.000 0.000 | 0.000 |
0.029 0.019 | 0.039 |
0.015 0.002 | 0.027 |
0.000 0.000 | 0.000 |
0.073 0.055 | 0.088 |
0.579 0.562 | 0.594 |
0.303 0.295 | 0.310 |
0.000 0.000 | 0.000 |
| 7 spectra, MEQDHSVR | 0.000 | 0.017 | 0.000 | 0.106 | 0.068 | 0.531 | 0.278 | 0.000 | ||
| 1 spectrum, SRPLSVDAR | 0.000 | 0.000 | 0.166 | 0.000 | 0.032 | 0.432 | 0.371 | 0.000 | ||
| 1 spectrum, DAPYDYK | 0.000 | 0.077 | 0.011 | 0.000 | 0.000 | 0.522 | 0.390 | 0.000 | ||
| 2 spectra, QFSQQEEK | 0.051 | 0.000 | 0.163 | 0.000 | 0.222 | 0.366 | 0.198 | 0.000 | ||
| 6 spectra, ALEEDLNQK | 0.000 | 0.030 | 0.000 | 0.000 | 0.096 | 0.608 | 0.267 | 0.000 | ||
| 2 spectra, LSEEAETRPTTPNR | 0.000 | 0.115 | 0.000 | 0.000 | 0.110 | 0.533 | 0.242 | 0.000 | ||
| 2 spectra, AGNVLMTLEGDIR | 0.000 | 0.107 | 0.000 | 0.000 | 0.079 | 0.391 | 0.423 | 0.000 | ||
| 4 spectra, EQEMFFR | 0.000 | 0.050 | 0.002 | 0.000 | 0.111 | 0.552 | 0.286 | 0.000 | ||
| 3 spectra, EAALWEMEEHQLQER | 0.000 | 0.000 | 0.104 | 0.000 | 0.277 | 0.390 | 0.229 | 0.000 | ||
| 3 spectra, FYDVELENLER | 0.000 | 0.010 | 0.000 | 0.000 | 0.063 | 0.646 | 0.281 | 0.000 |
| Plot | Mito | Lyso or Perox | ER | Golgi | PM | Cytosol | Nucleus | ||||||
| Expt B |
2 peptides |
2 spectra |
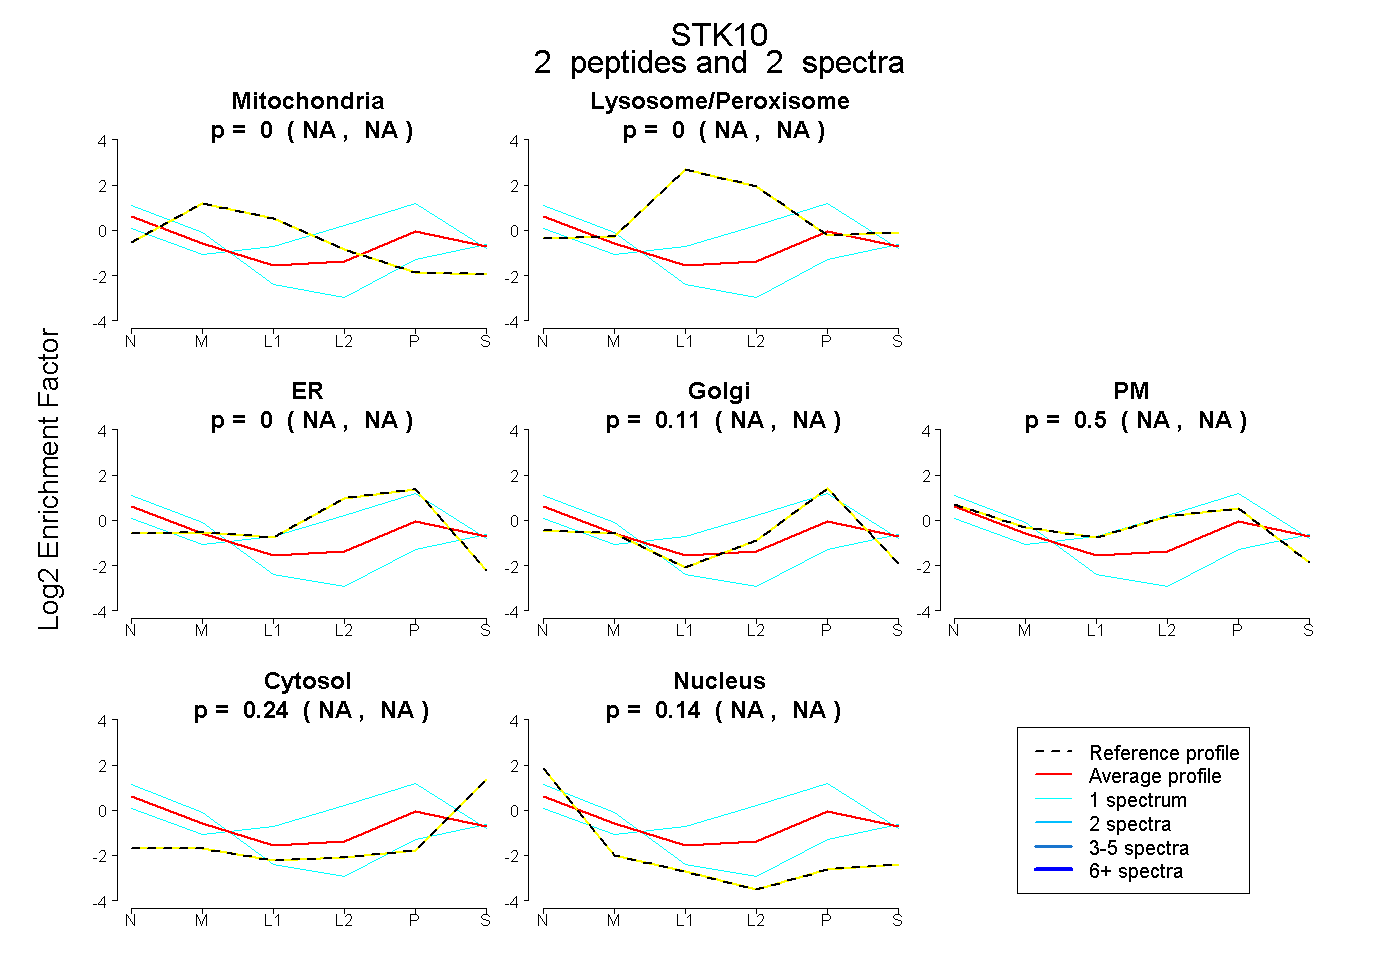 |
0.000 NA | NA |
0.000 NA | NA |
0.000 NA | NA |
0.113 NA | NA |
0.502 NA | NA |
0.241 NA | NA |
0.144 NA | NA |
|||
| Plot | Lyso | Other | |||||||||||
| Expt C |
13 peptides |
21 spectra |
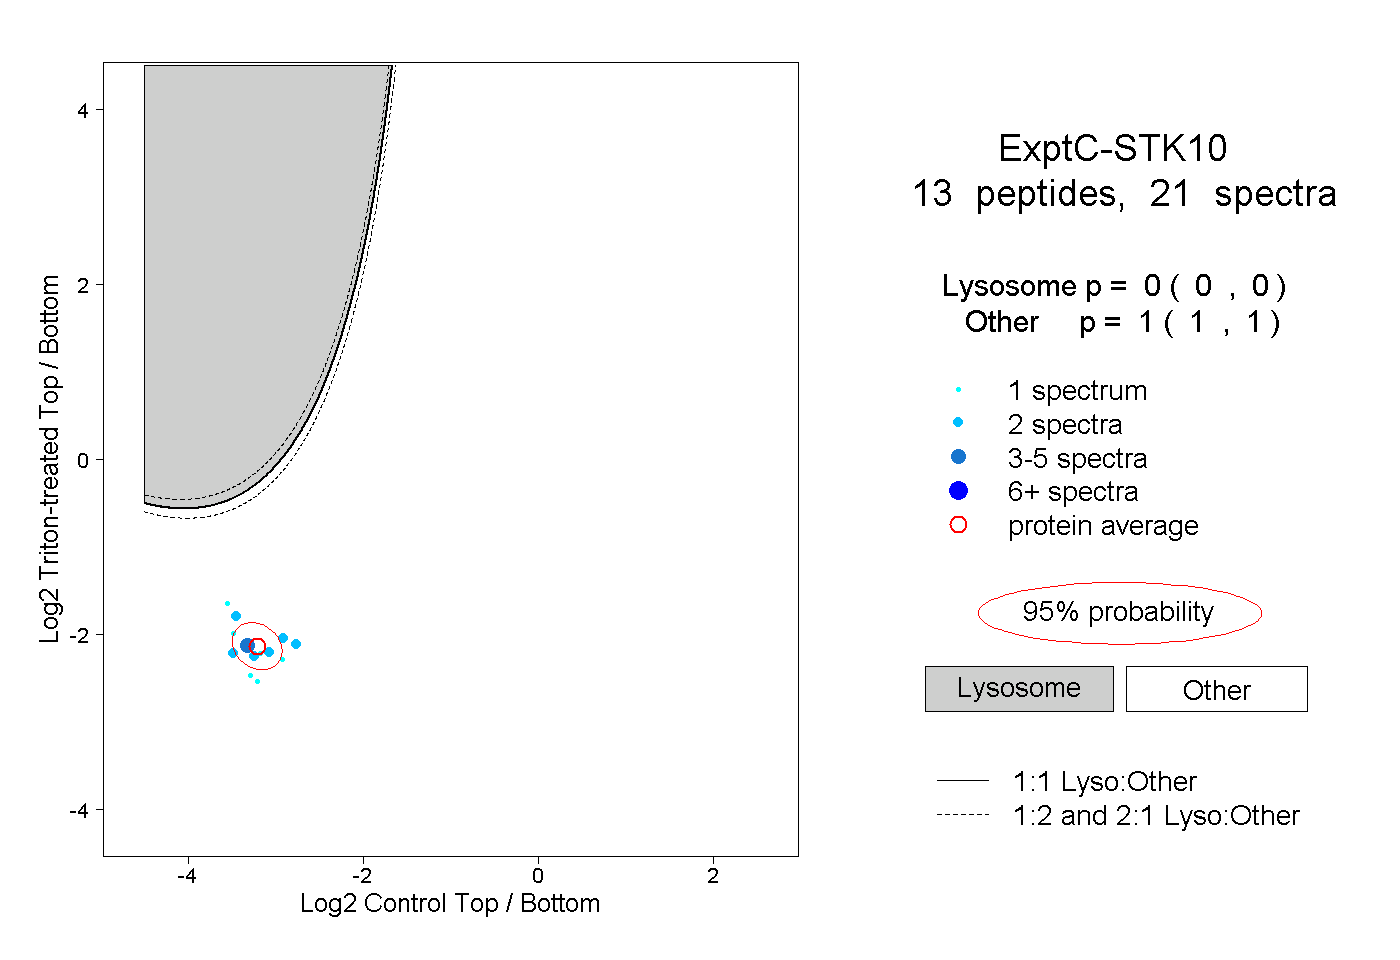 |
0.000 0.000 | 0.000 |
1.000 1.000 | 1.000 |
||||||||
| Plot | Lyso | Other | |||||||||||
| Expt D |
2 peptides |
2 spectra |
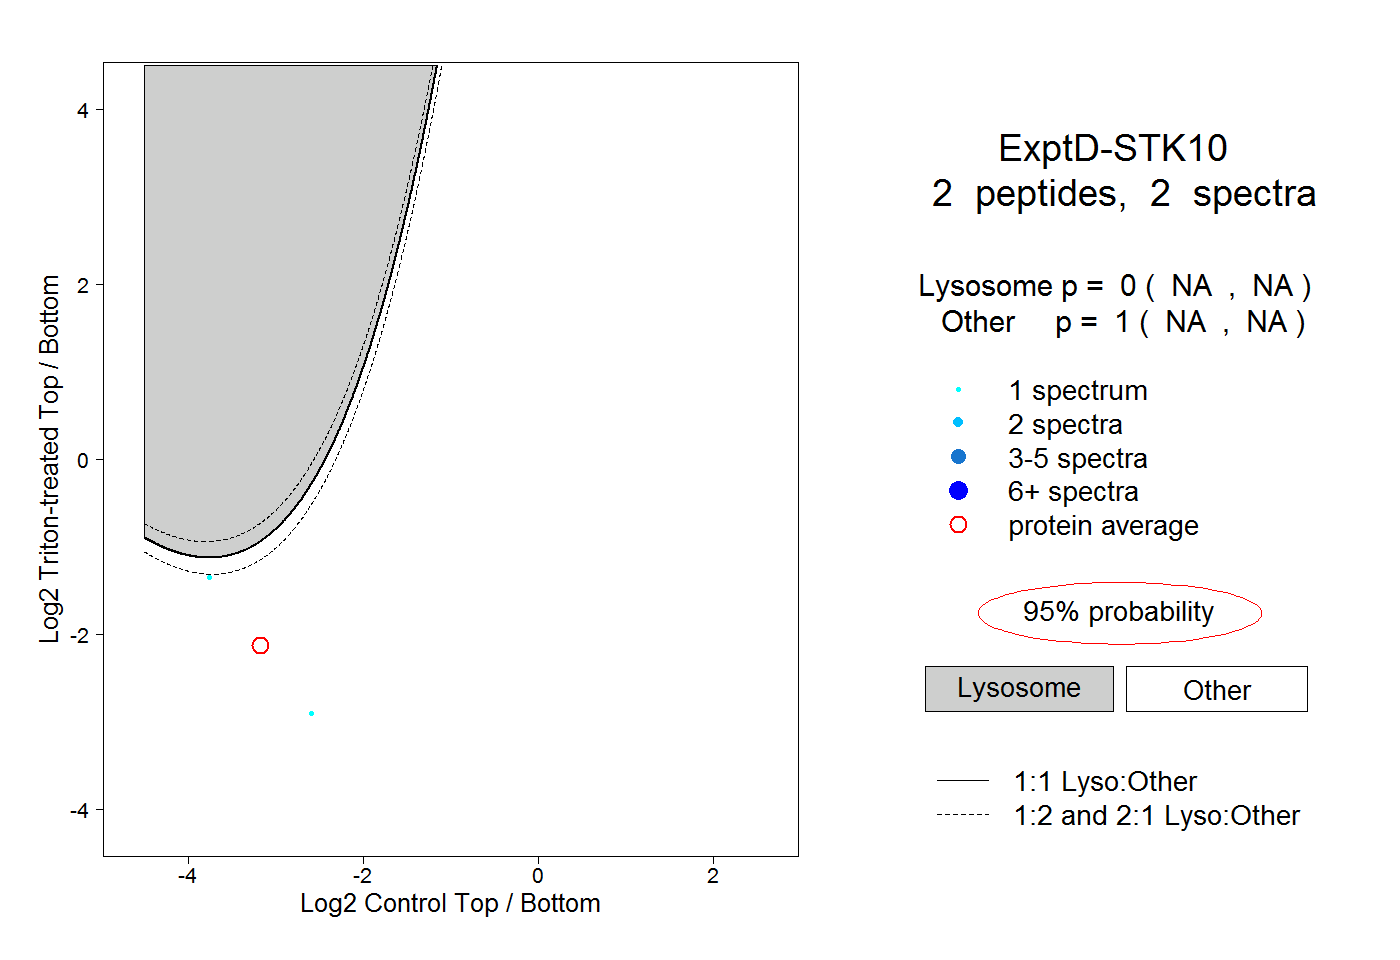 |
0.000 NA | NA |
1.000 NA | NA |