 2
2peptides
spectra
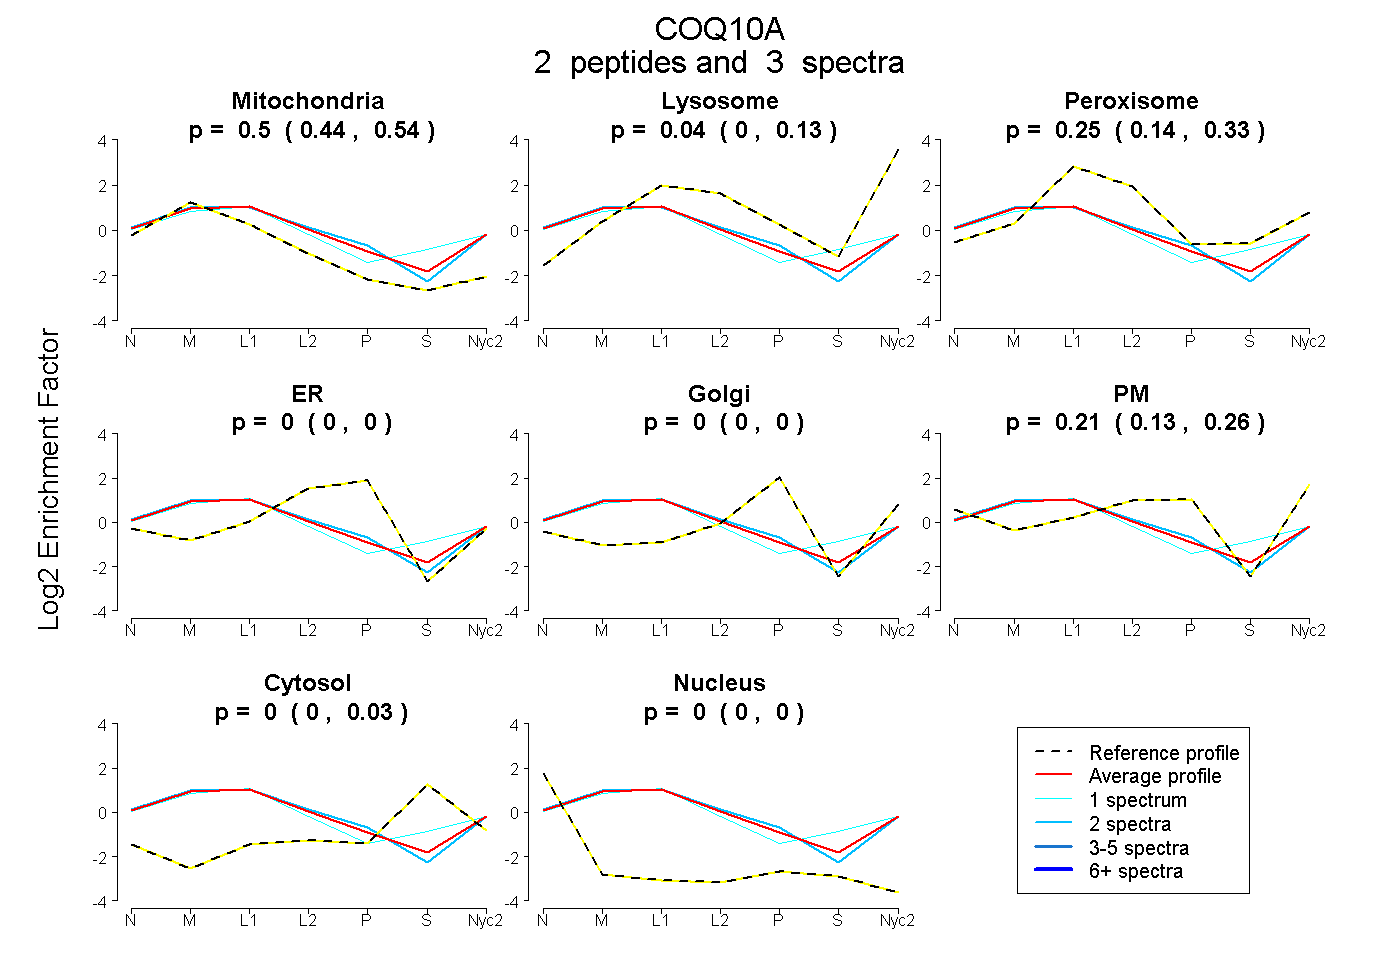
0.435 | 0.540
0.000 | 0.129
0.138 | 0.332
0.000 | 0.000
0.000 | 0.000
0.128 | 0.258
0.000 | 0.033
0.000 | 0.000
6peptides
spectra
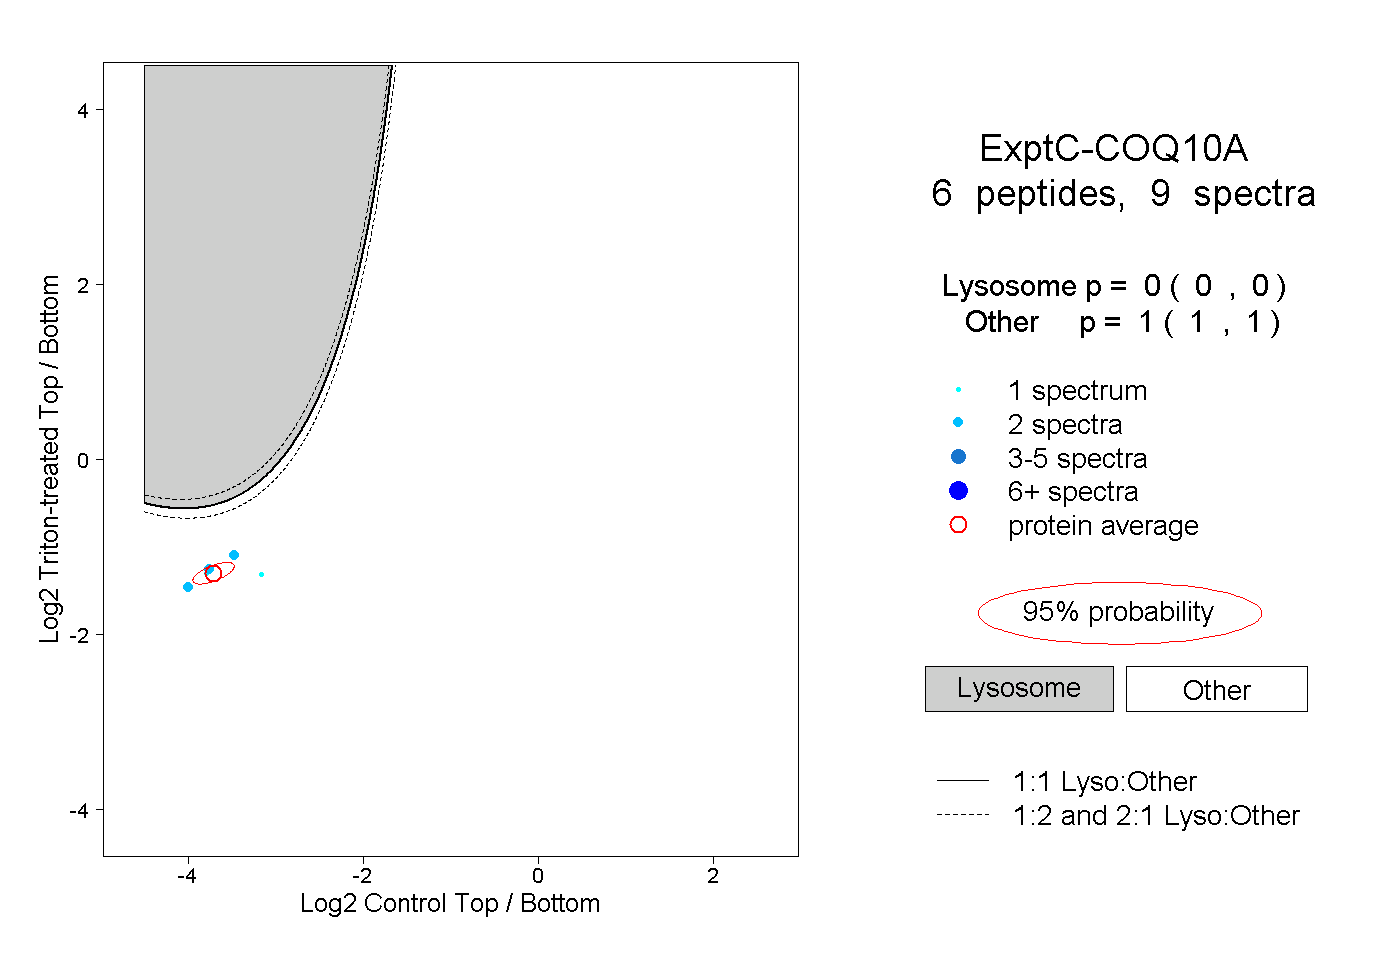
0.000 | 0.000
1.000 | 1.000
1peptide
spectra
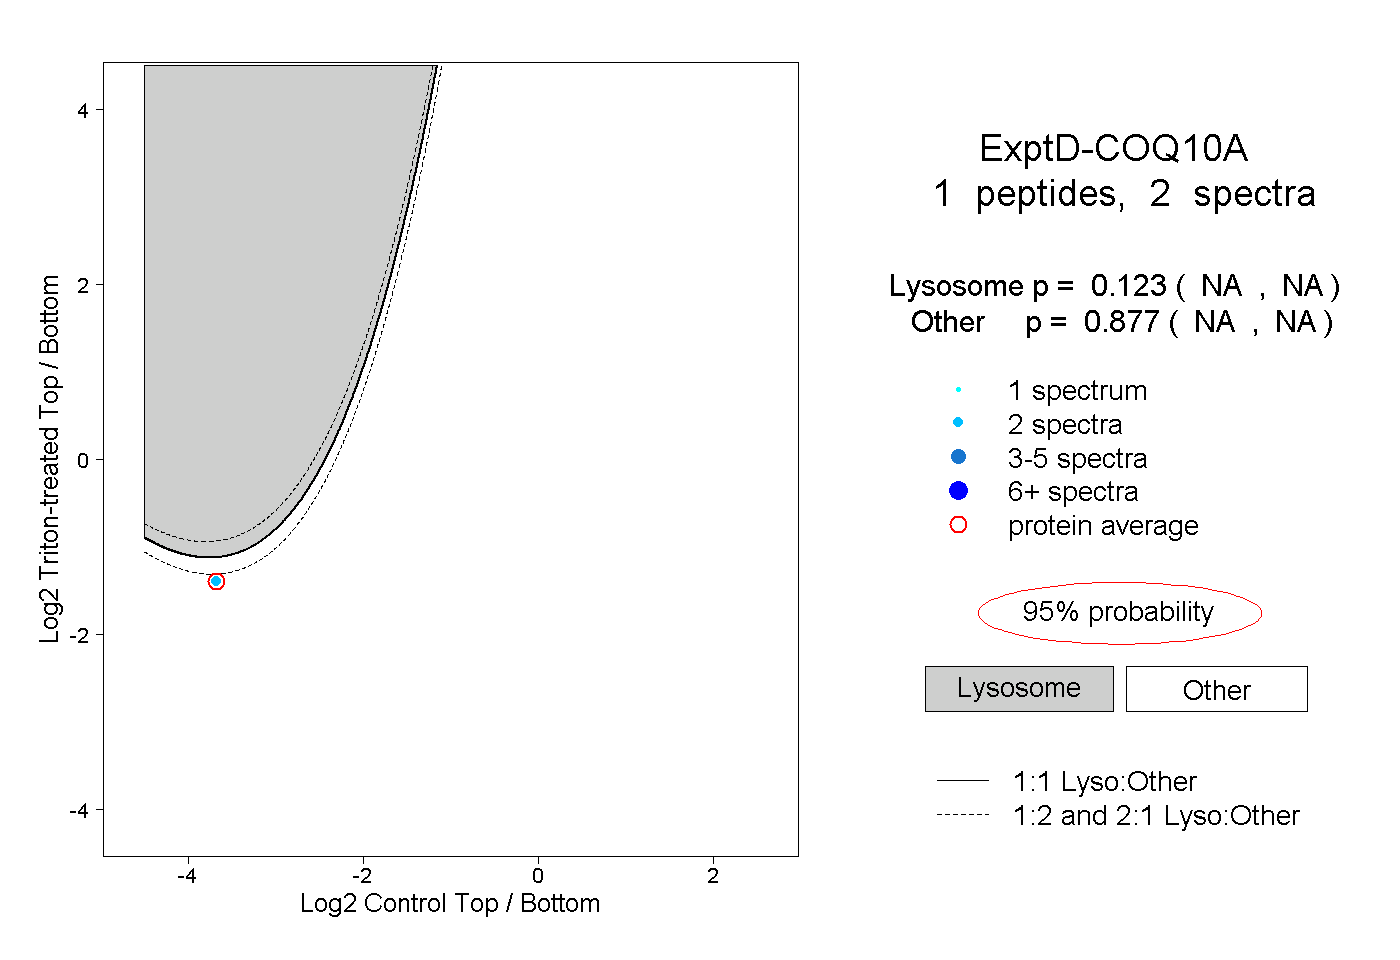
NA | NA
NA | NA