 2
2peptides
spectra
0.435 | 0.540
0.000 | 0.129
0.138 | 0.332
0.000 | 0.000
0.000 | 0.000
0.128 | 0.258
0.000 | 0.033
0.000 | 0.000
| Plot | Mito | Lyso | Perox | ER | Golgi | PM | Cytosol | Nucleus | |||||
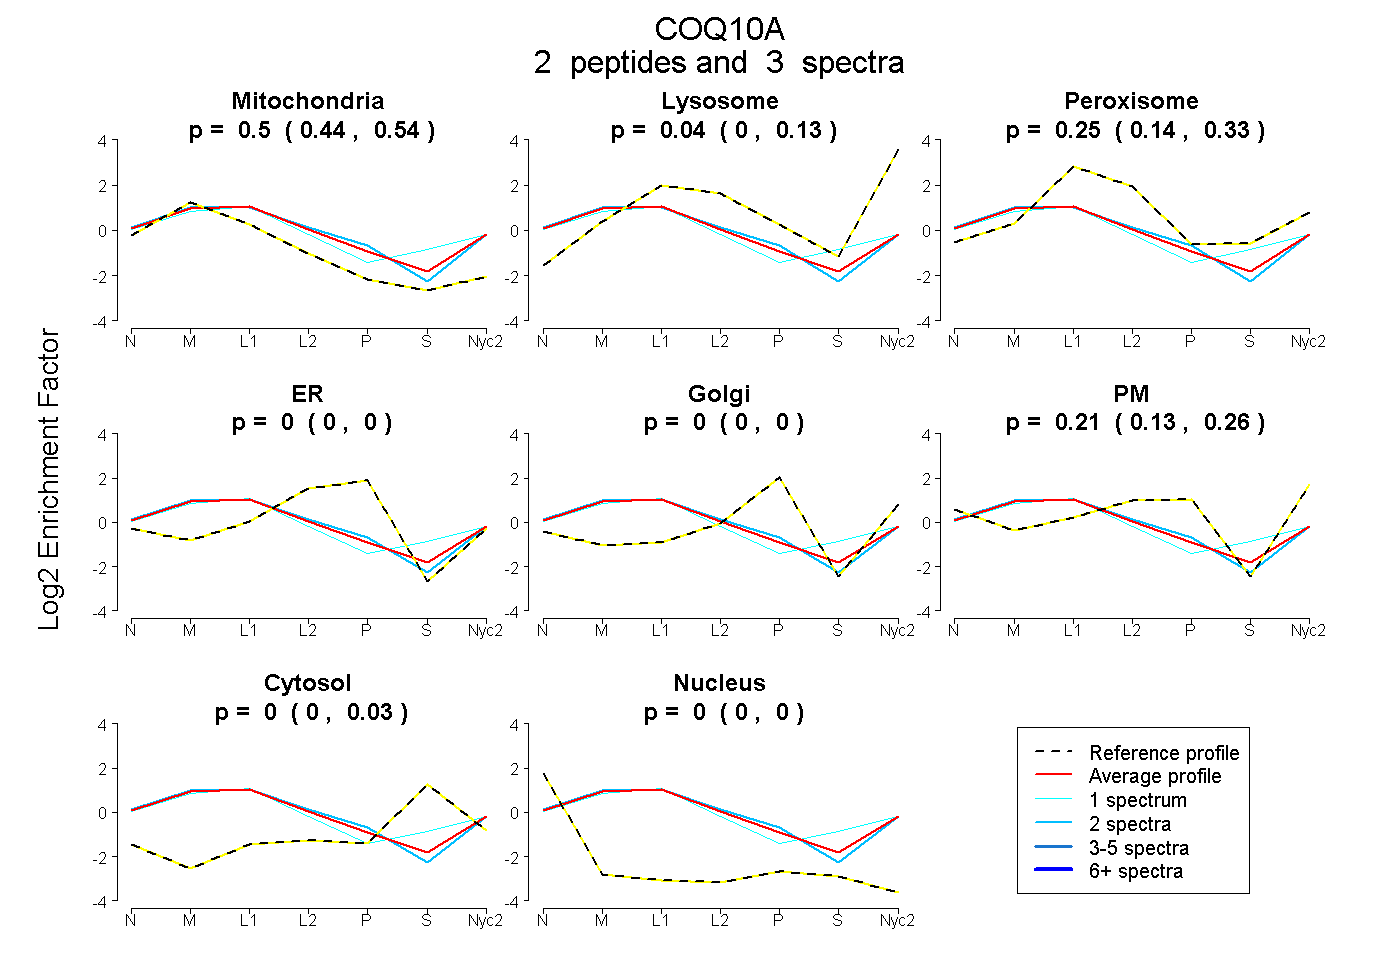
| Expt A |
2 peptides |
3 spectra |
|
0.497 0.435 | 0.540 |
0.043 0.000 | 0.129 |
0.253 0.138 | 0.332 |
0.000 0.000 | 0.000 |
0.000 0.000 | 0.000 |
0.207 0.128 | 0.258 |
0.000 0.000 | 0.033 |
0.000 0.000 | 0.000 |
| 1 spectrum, FSPGIPAYPR | 0.457 | 0.075 | 0.353 | 0.000 | 0.000 | 0.000 | 0.114 | 0.000 | ||
| 2 spectra, LFNHLETIWR | 0.485 | 0.027 | 0.193 | 0.000 | 0.000 | 0.296 | 0.000 | 0.000 |
| Plot | Lyso | Other | |||||||||||
| Expt C |
6 peptides |
9 spectra |
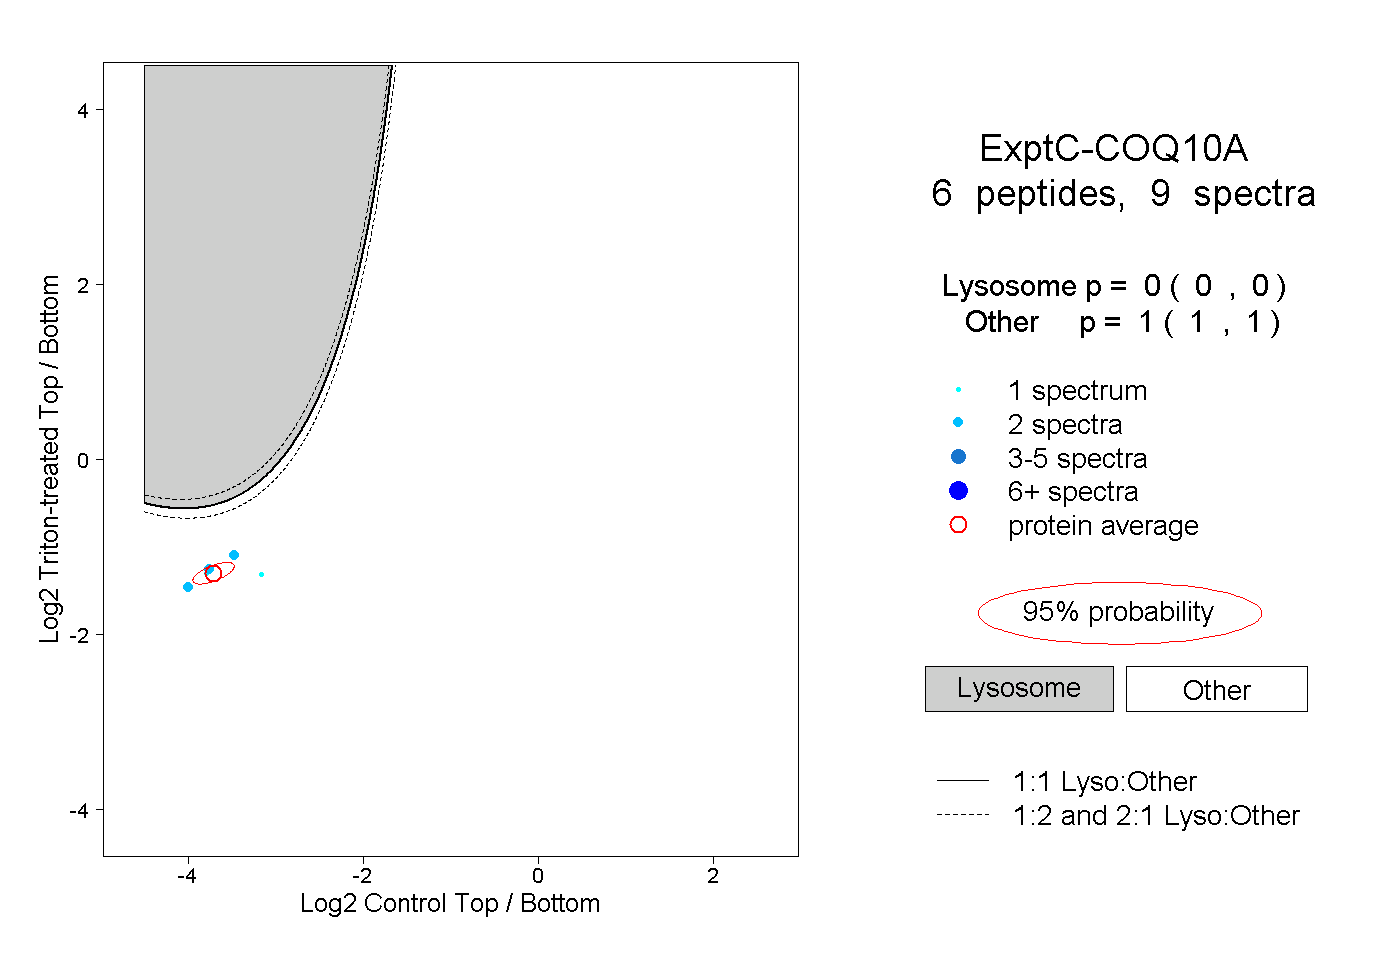 |
0.000 0.000 | 0.000 |
1.000 1.000 | 1.000 |
||||||||
| Plot | Lyso | Other | |||||||||||
| Expt D |
1 peptide |
2 spectra |
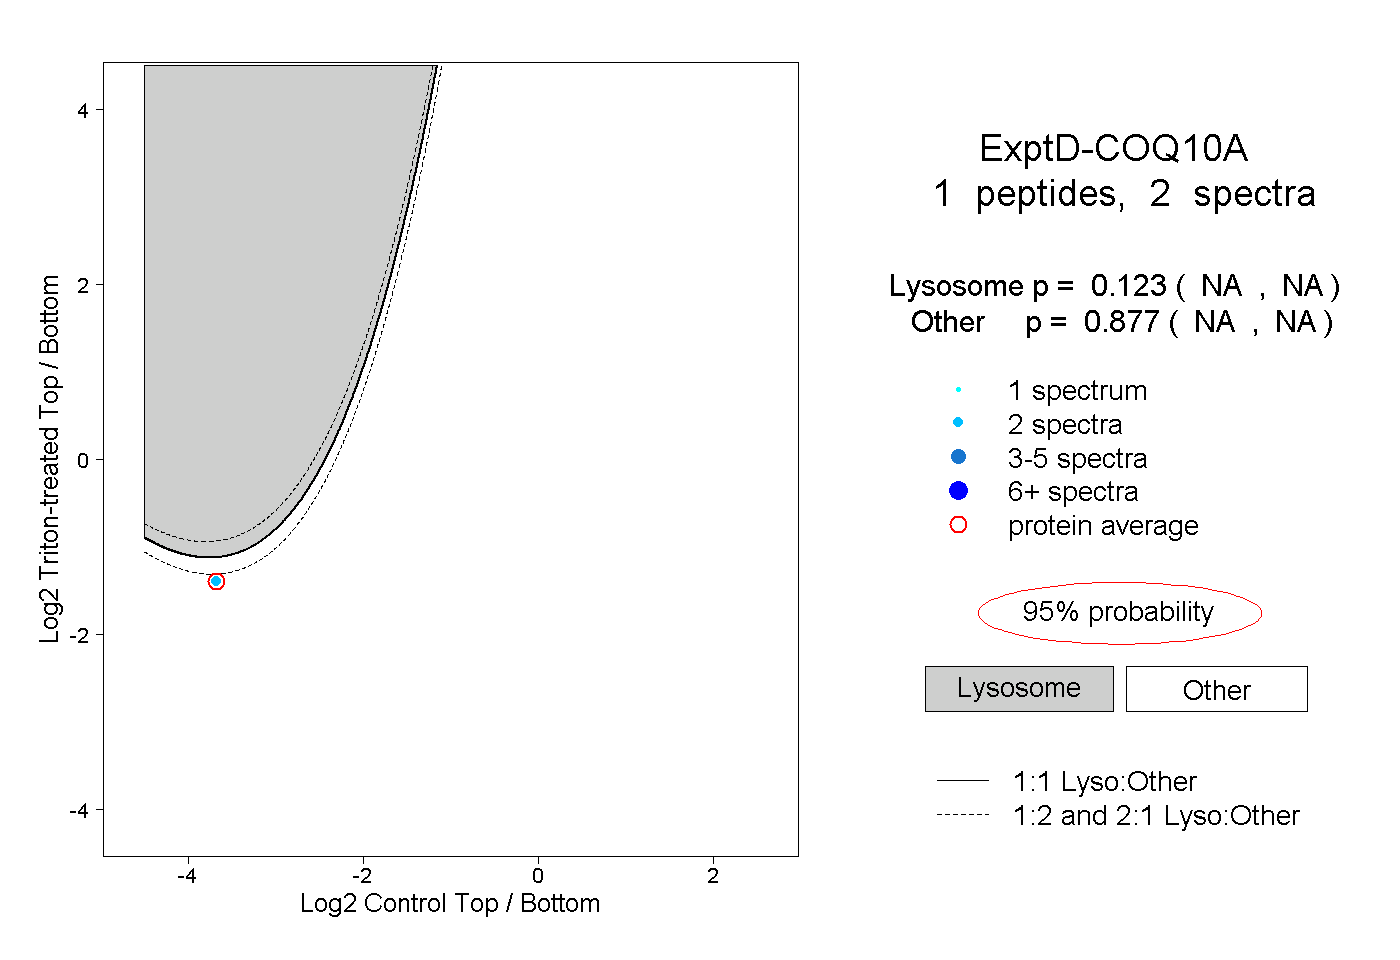 |
0.123 NA | NA |
0.877 NA | NA |