 9
9peptides
spectra
0.026 | 0.120
0.000 | 0.000
0.000 | 0.090
0.000 | 0.177
0.000 | 0.149
0.000 | 0.140
0.264 | 0.330
0.344 | 0.405
1peptide
spectrum
NA | NA
NA | NA
NA | NA
NA | NA
NA | NA
NA | NA
NA | NA
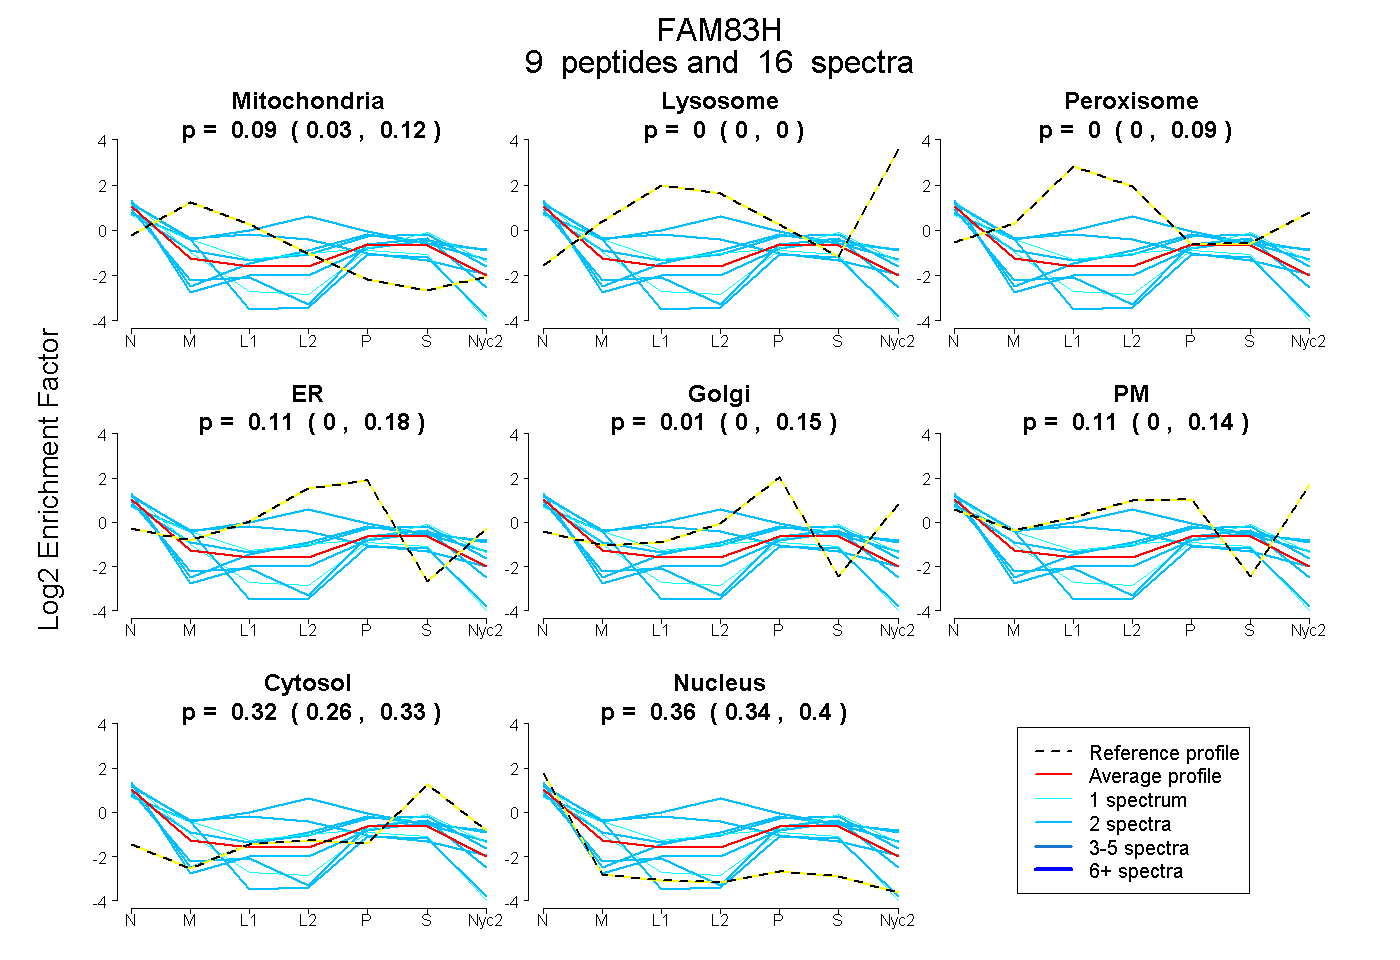
| Plot | Mito | Lyso | Perox | ER | Golgi | PM | Cytosol | Nucleus | |||||
| Expt A |
9 peptides |
16 spectra |
|
0.086 0.026 | 0.120 |
0.000 0.000 | 0.000 |
0.000 0.000 | 0.090 |
0.114 0.000 | 0.177 |
0.010 0.000 | 0.149 |
0.105 0.000 | 0.140 |
0.320 0.264 | 0.330 |
0.364 0.344 | 0.405 |
||
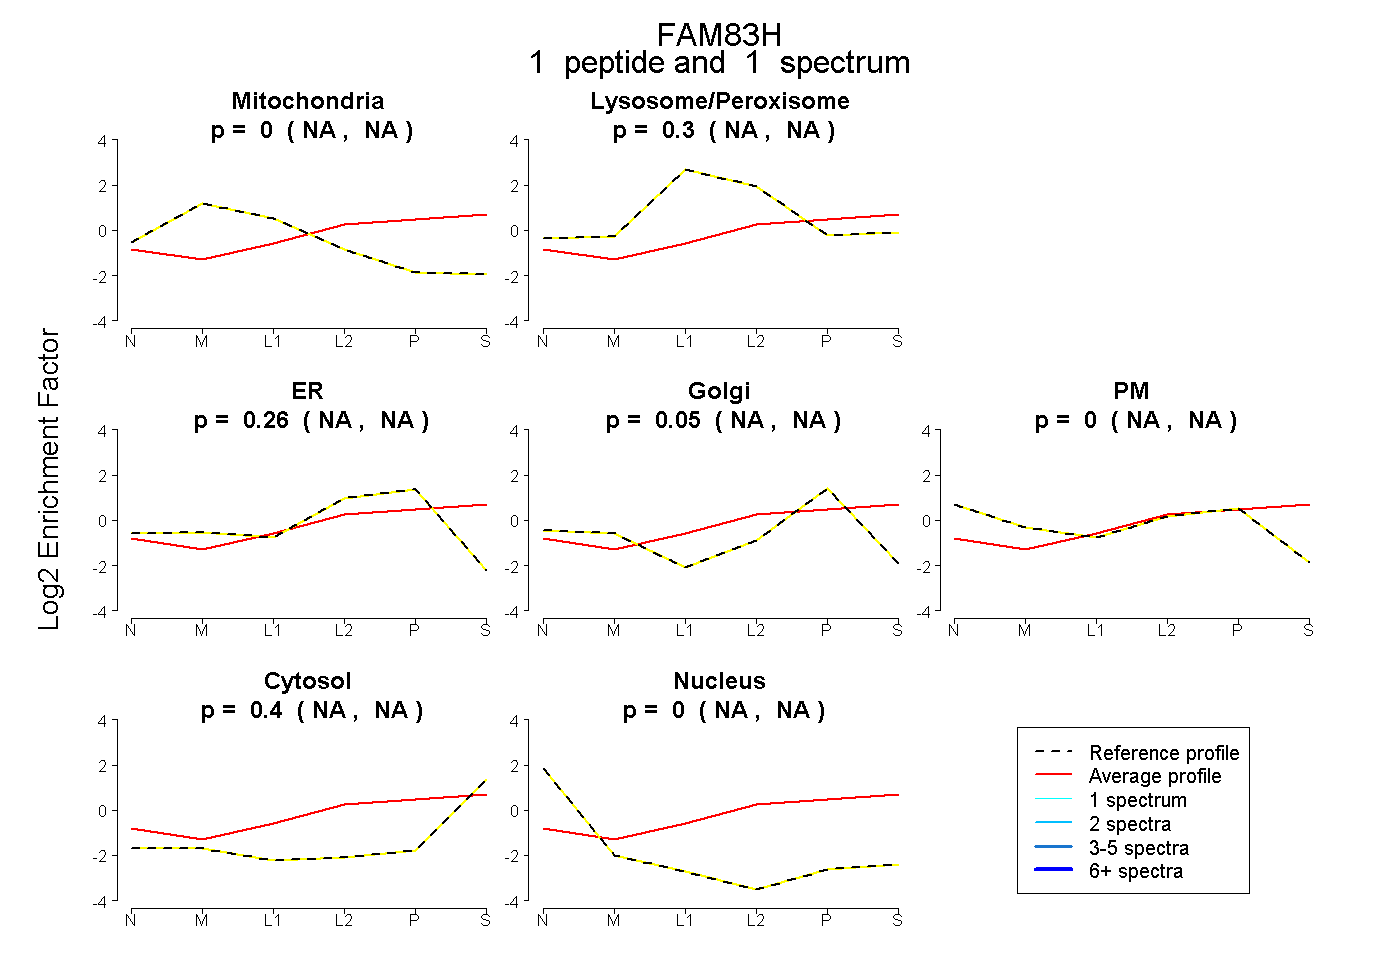
| Plot | Mito | Lyso or Perox | ER | Golgi | PM | Cytosol | Nucleus | ||||||
| Expt B |
1 peptide |
1 spectrum |
|
0.000 NA | NA |
0.296 NA | NA |
0.256 NA | NA |
0.048 NA | NA |
0.000 NA | NA |
0.401 NA | NA |
0.000 NA | NA |