 4
4peptides
spectra
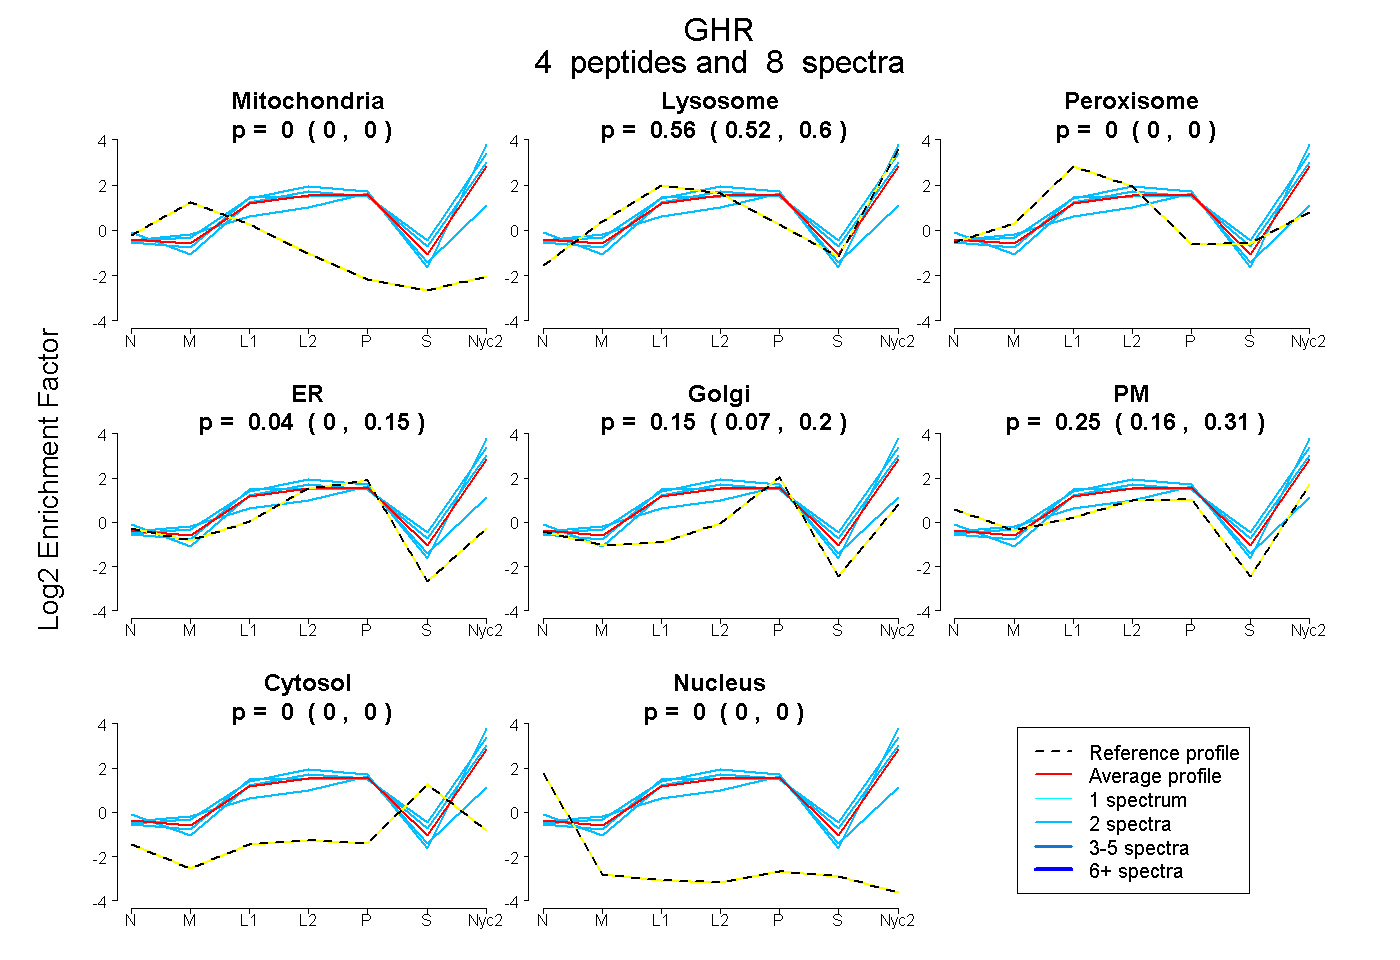
0.000 | 0.000
0.518 | 0.602
0.000 | 0.000
0.000 | 0.154
0.071 | 0.195
0.163 | 0.307
0.000 | 0.000
0.000 | 0.000
1peptide
spectrum
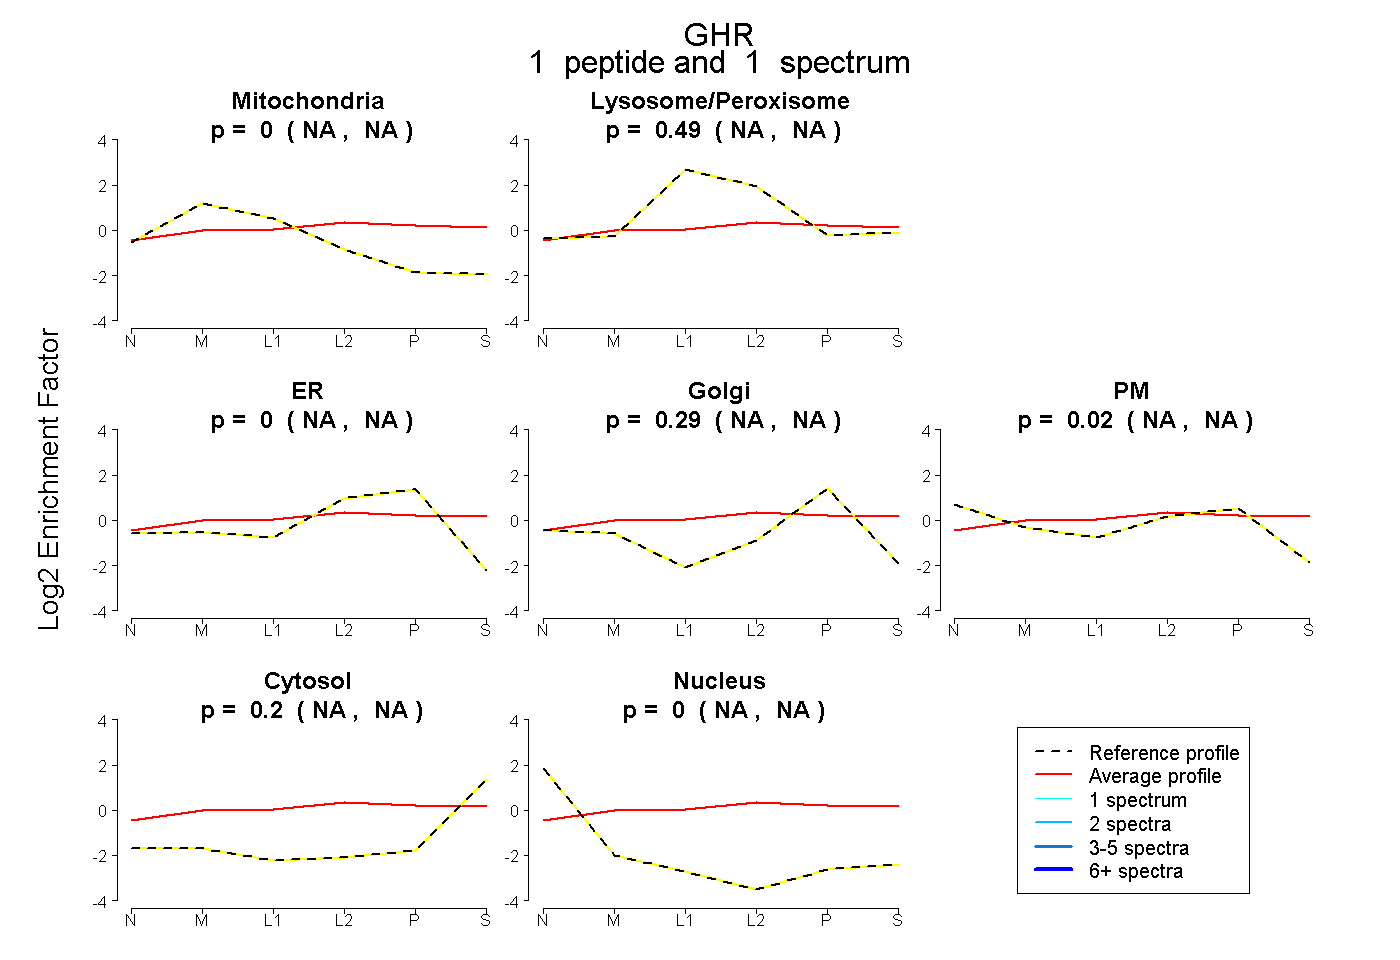
NA | NA
NA | NA
NA | NA
NA | NA
NA | NA
NA | NA
NA | NA
9peptides
spectra
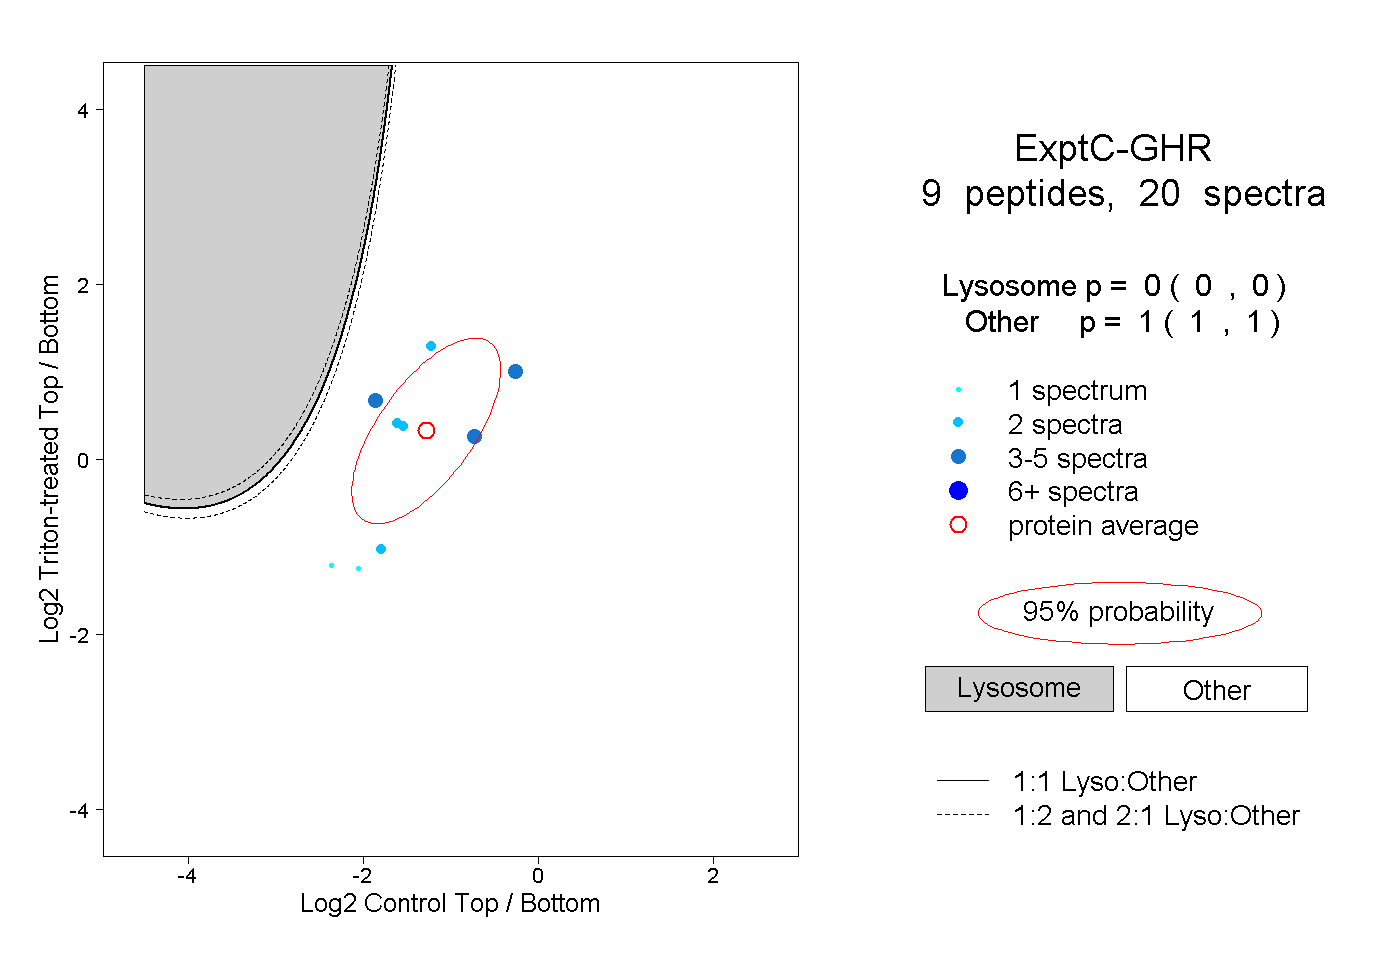
0.000 | 0.000
1.000 | 1.000
3peptides
spectra
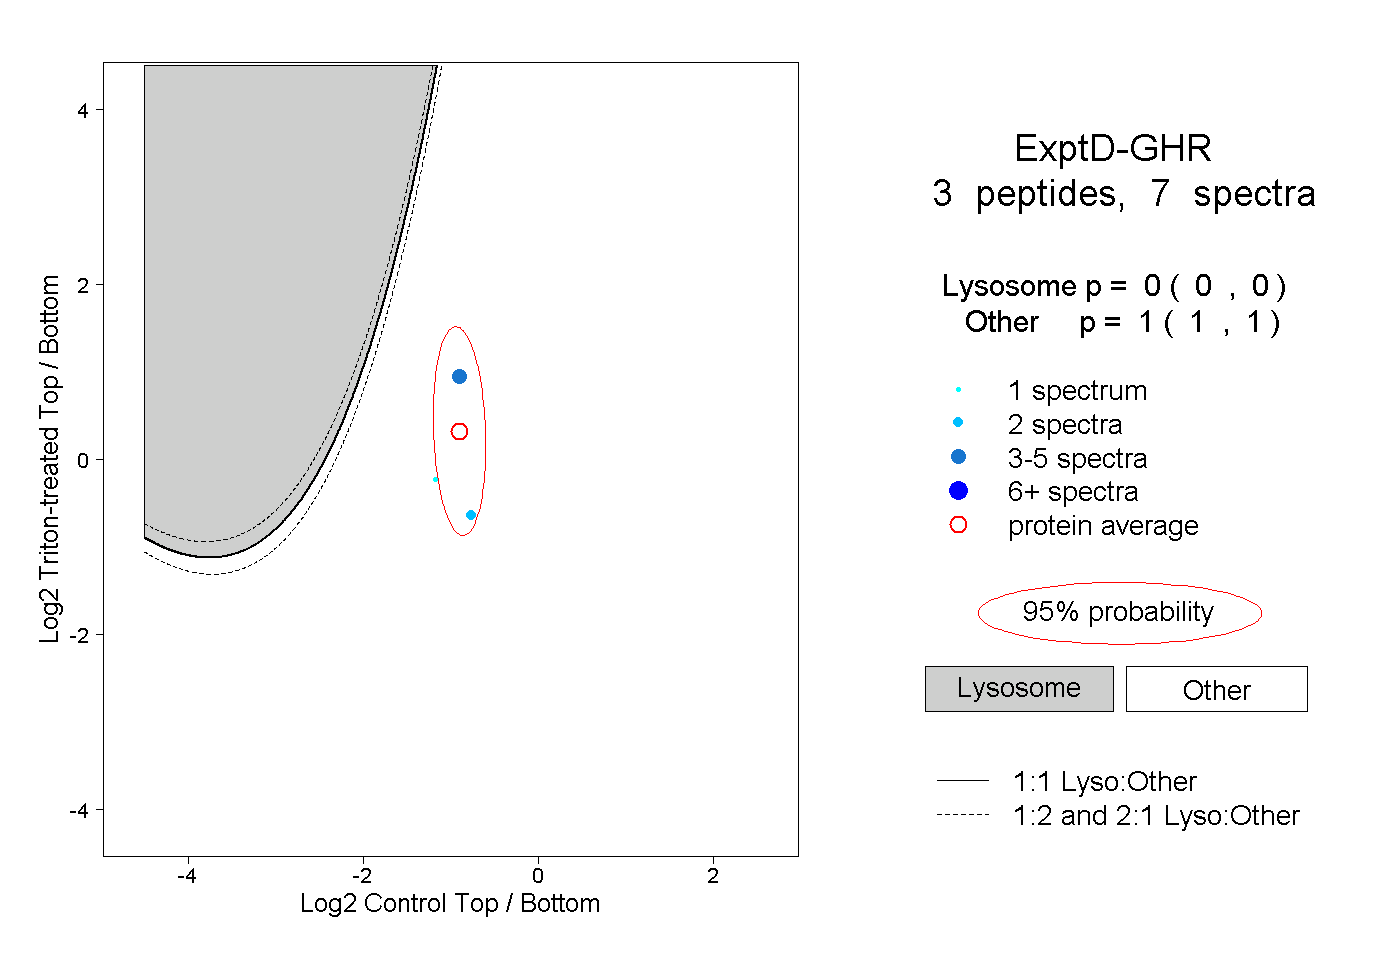
0.000 | 0.000
1.000 | 1.000