 4
4peptides
spectra
0.000 | 0.000
0.518 | 0.602
0.000 | 0.000
0.000 | 0.154
0.071 | 0.195
0.163 | 0.307
0.000 | 0.000
0.000 | 0.000
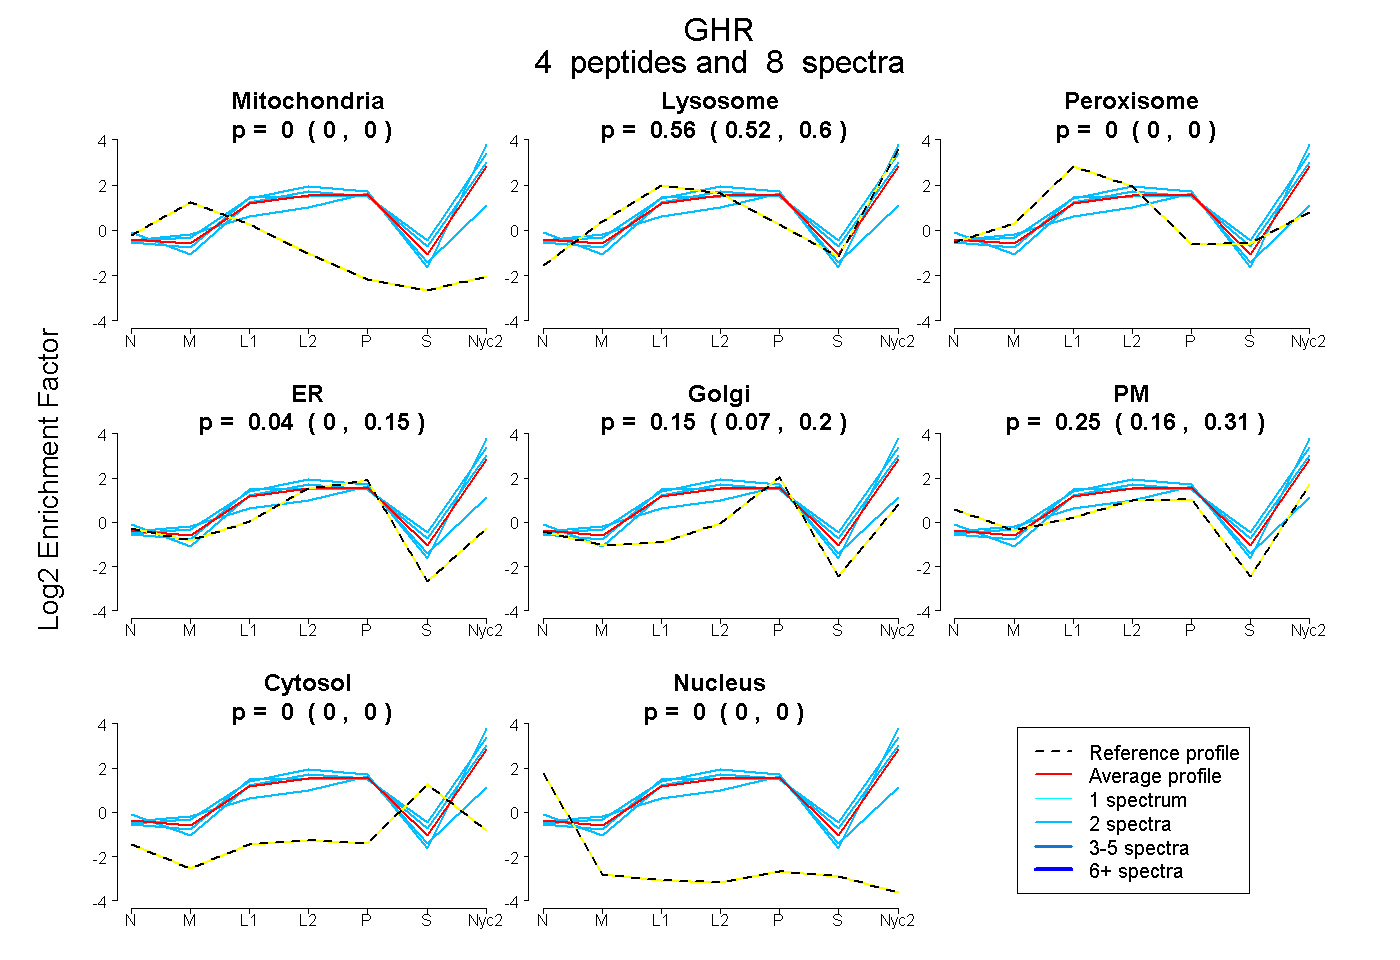
| Plot | Mito | Lyso | Perox | ER | Golgi | PM | Cytosol | Nucleus | |||||
| Expt A |
4 peptides |
8 spectra |
|
0.000 0.000 | 0.000 |
0.561 0.518 | 0.602 |
0.000 0.000 | 0.000 |
0.039 0.000 | 0.154 |
0.149 0.071 | 0.195 |
0.251 0.163 | 0.307 |
0.000 0.000 | 0.000 |
0.000 0.000 | 0.000 |
| 2 spectra, VPGSIQLYYAR | 0.000 | 0.735 | 0.000 | 0.000 | 0.157 | 0.095 | 0.012 | 0.000 | ||
| 2 spectra, YSEFSEVLR | 0.000 | 0.656 | 0.000 | 0.000 | 0.000 | 0.344 | 0.000 | 0.000 | ||
| 2 spectra, IAHEWTPEWK | 0.000 | 0.525 | 0.000 | 0.000 | 0.030 | 0.416 | 0.029 | 0.000 | ||
| 2 spectra, ASPVLQR | 0.000 | 0.184 | 0.208 | 0.189 | 0.419 | 0.000 | 0.000 | 0.000 |
| Plot | Mito | Lyso or Perox | ER | Golgi | PM | Cytosol | Nucleus | ||||||
| Expt B |
1 peptide |
1 spectrum |
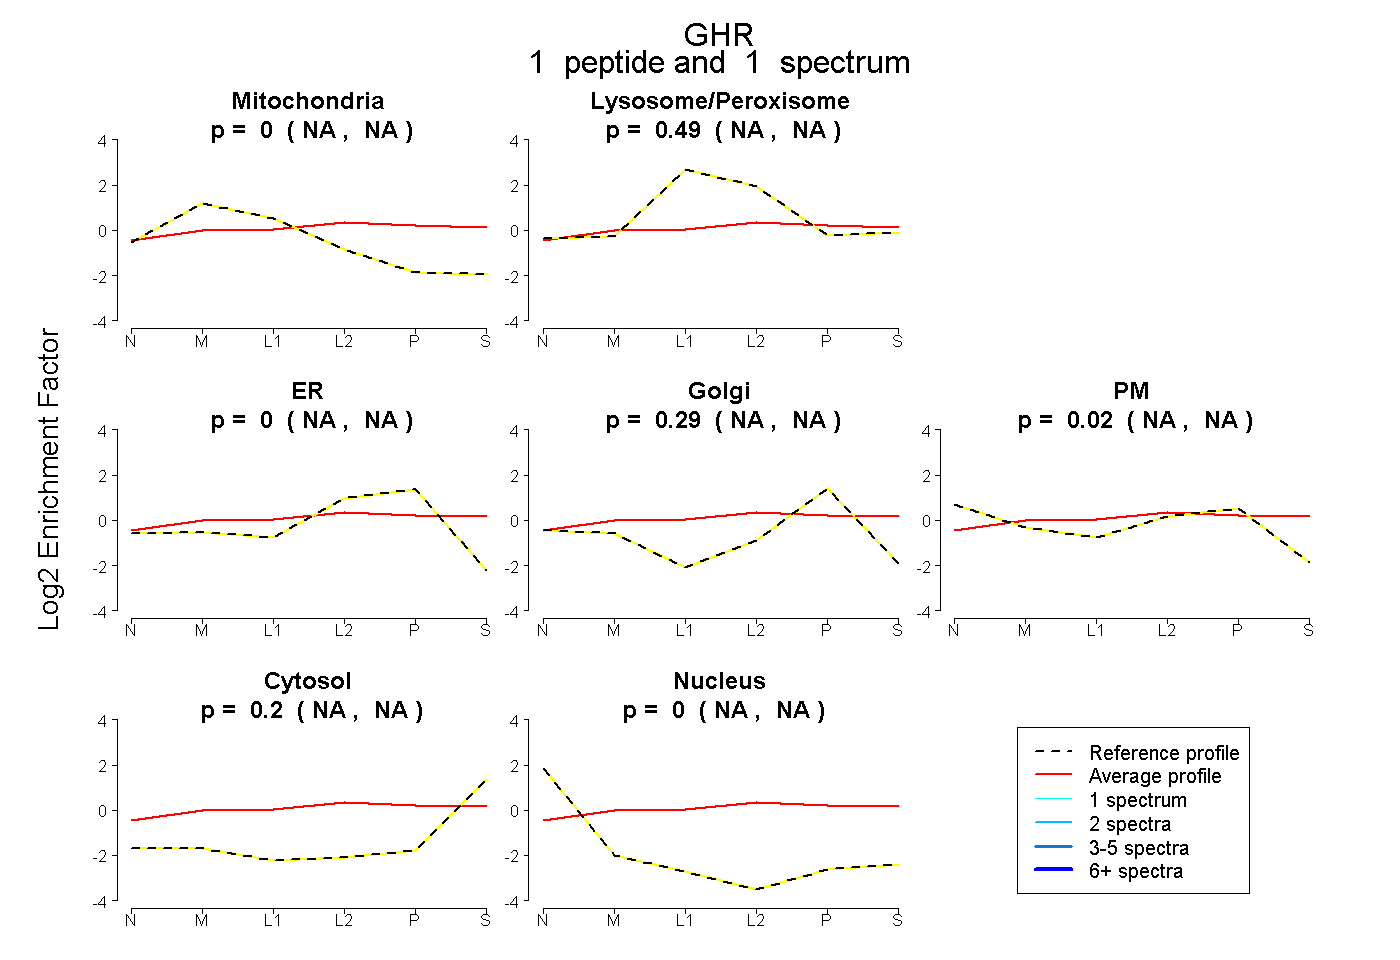 |
0.000 NA | NA |
0.488 NA | NA |
0.000 NA | NA |
0.291 NA | NA |
0.020 NA | NA |
0.201 NA | NA |
0.000 NA | NA |
|||
| Plot | Lyso | Other | |||||||||||
| Expt C |
9 peptides |
20 spectra |
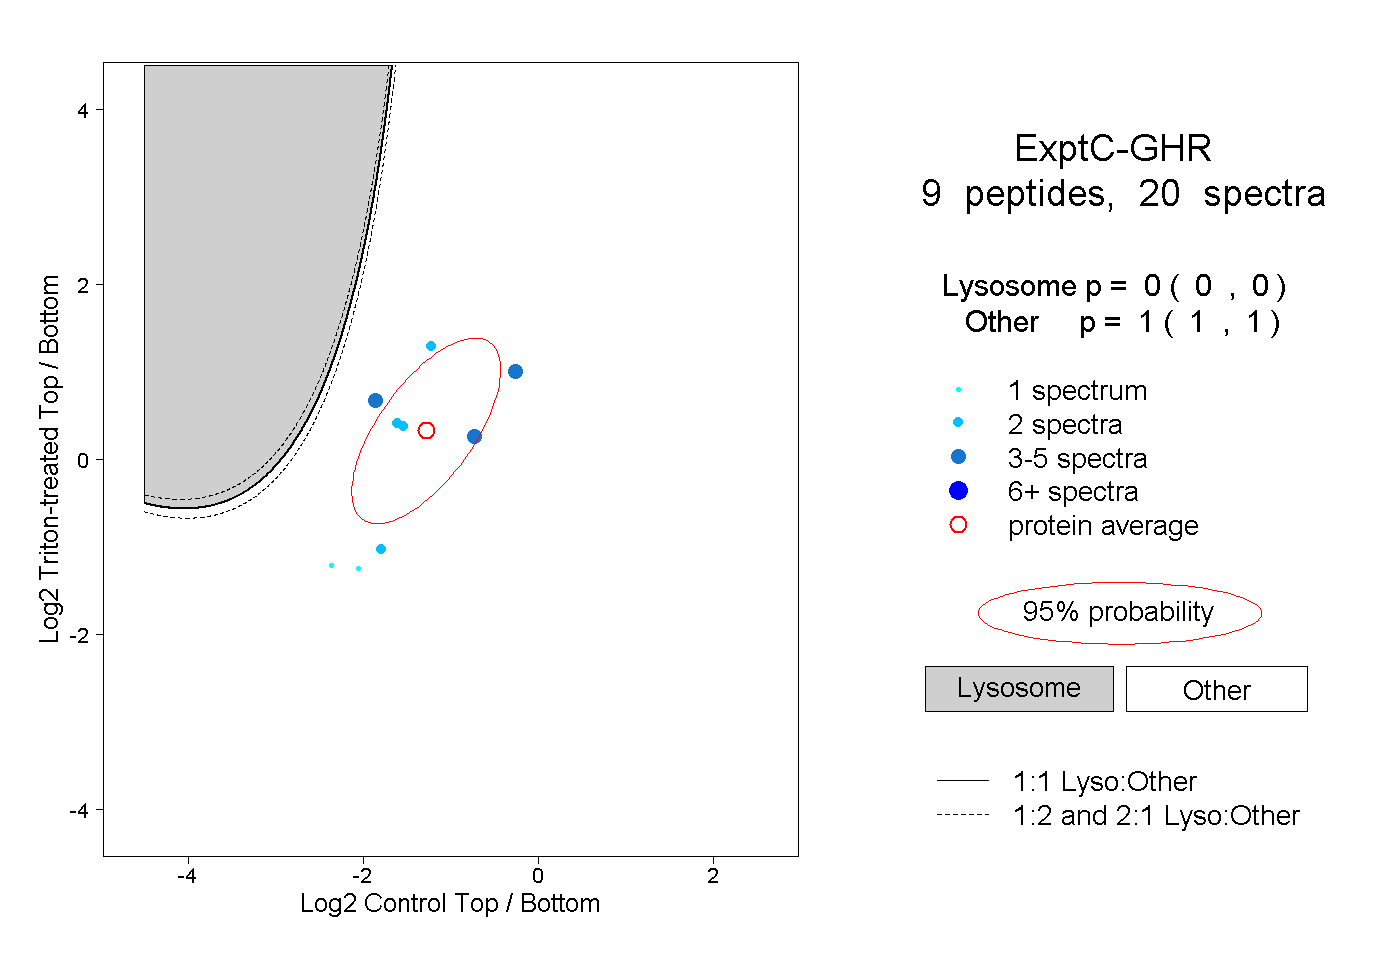 |
0.000 0.000 | 0.000 |
1.000 1.000 | 1.000 |
||||||||
| Plot | Lyso | Other | |||||||||||
| Expt D |
3 peptides |
7 spectra |
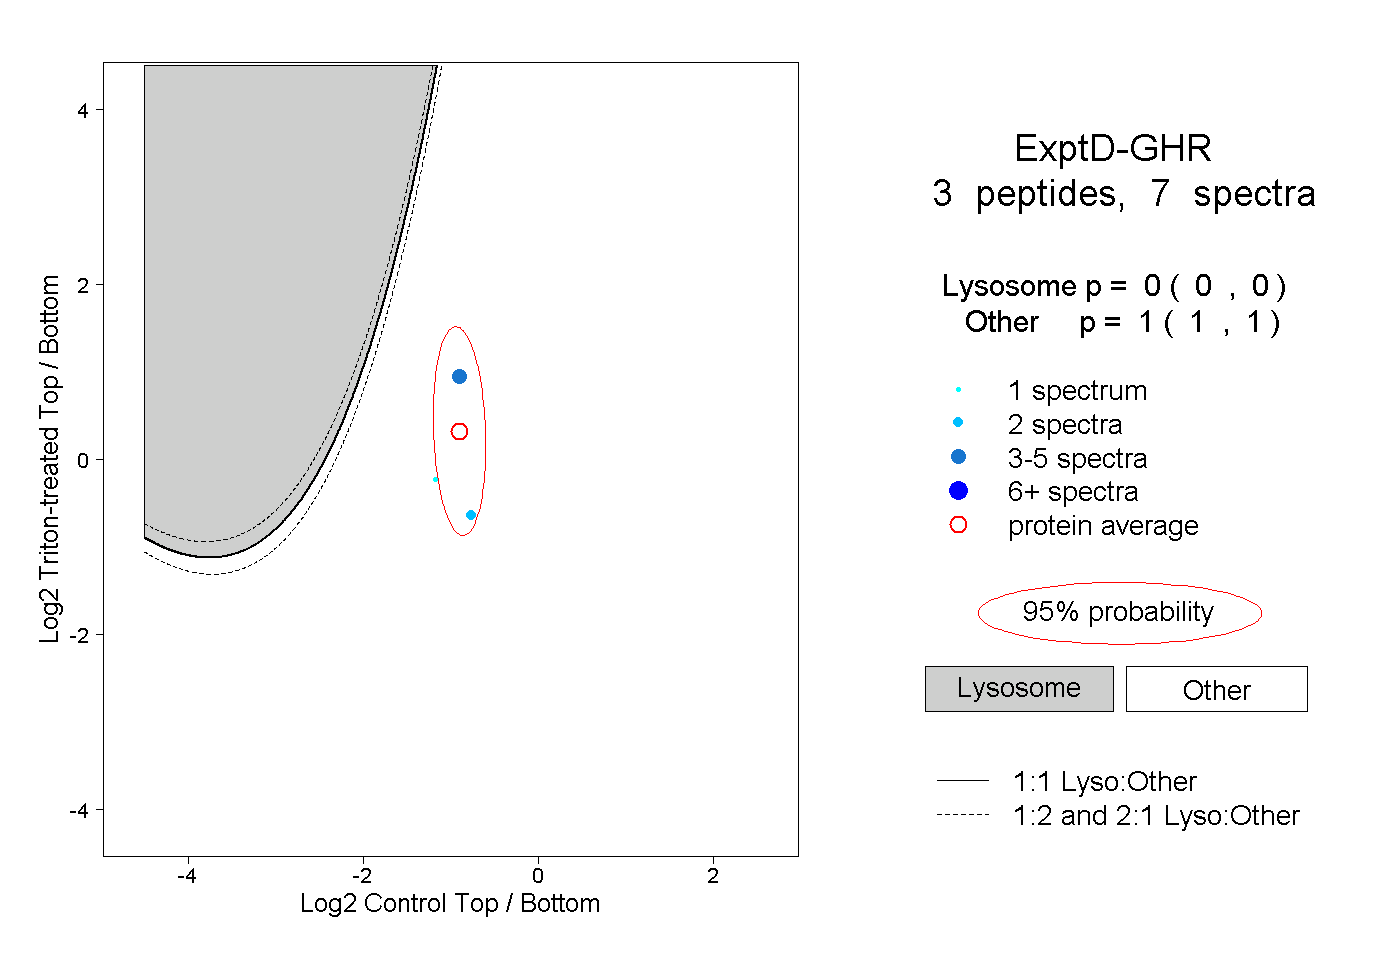 |
0.000 0.000 | 0.000 |
1.000 1.000 | 1.000 |