 9
9peptides
spectra
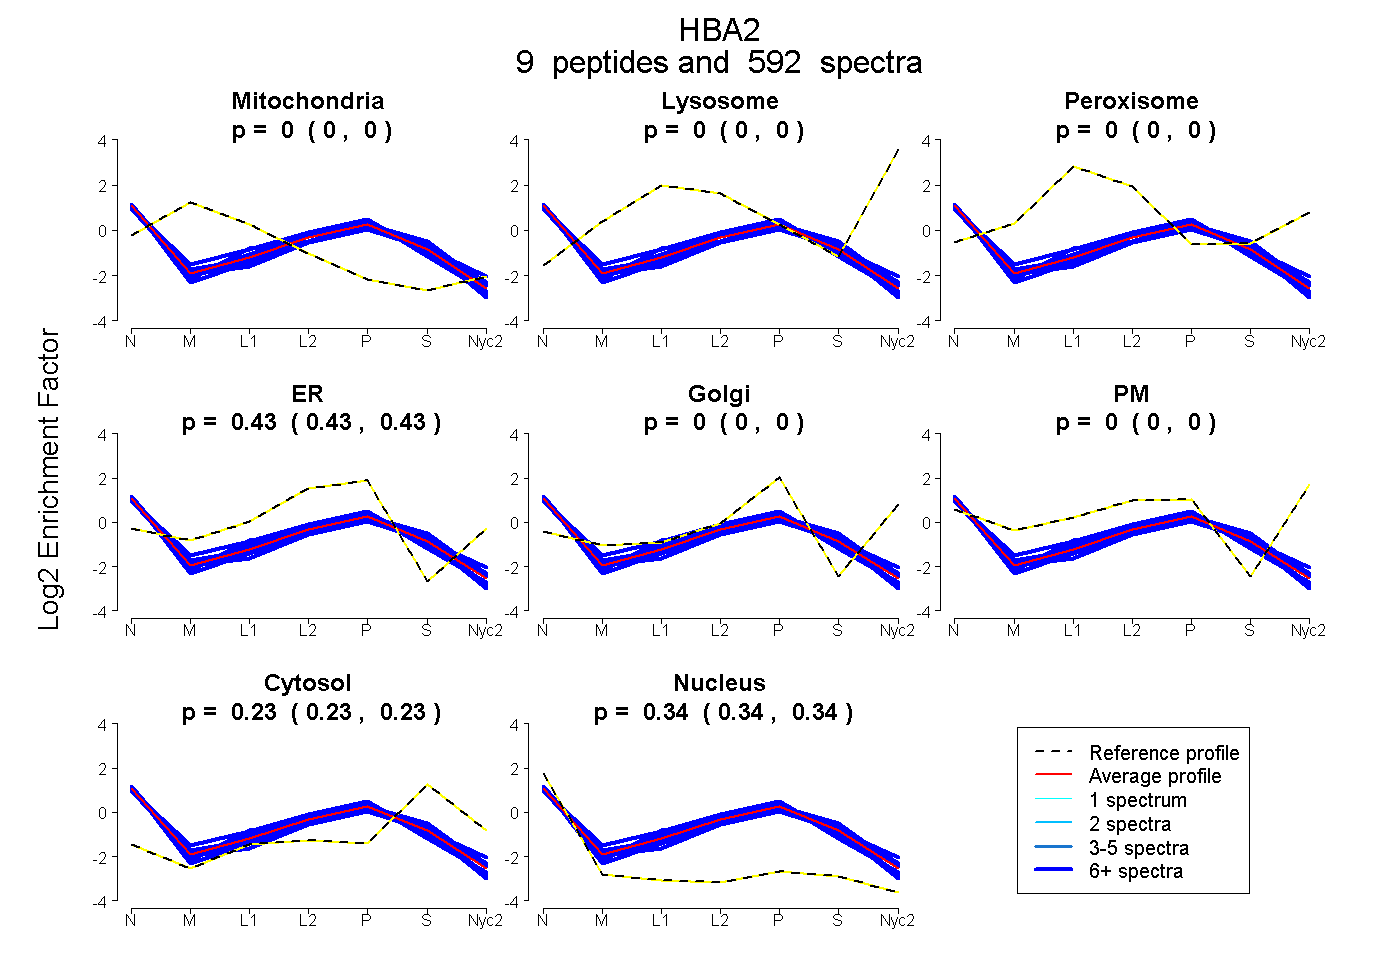
0.000 | 0.000
0.000 | 0.000
0.000 | 0.000
0.430 | 0.432
0.000 | 0.000
0.000 | 0.000
0.230 | 0.232
0.337 | 0.339
8peptides
spectra
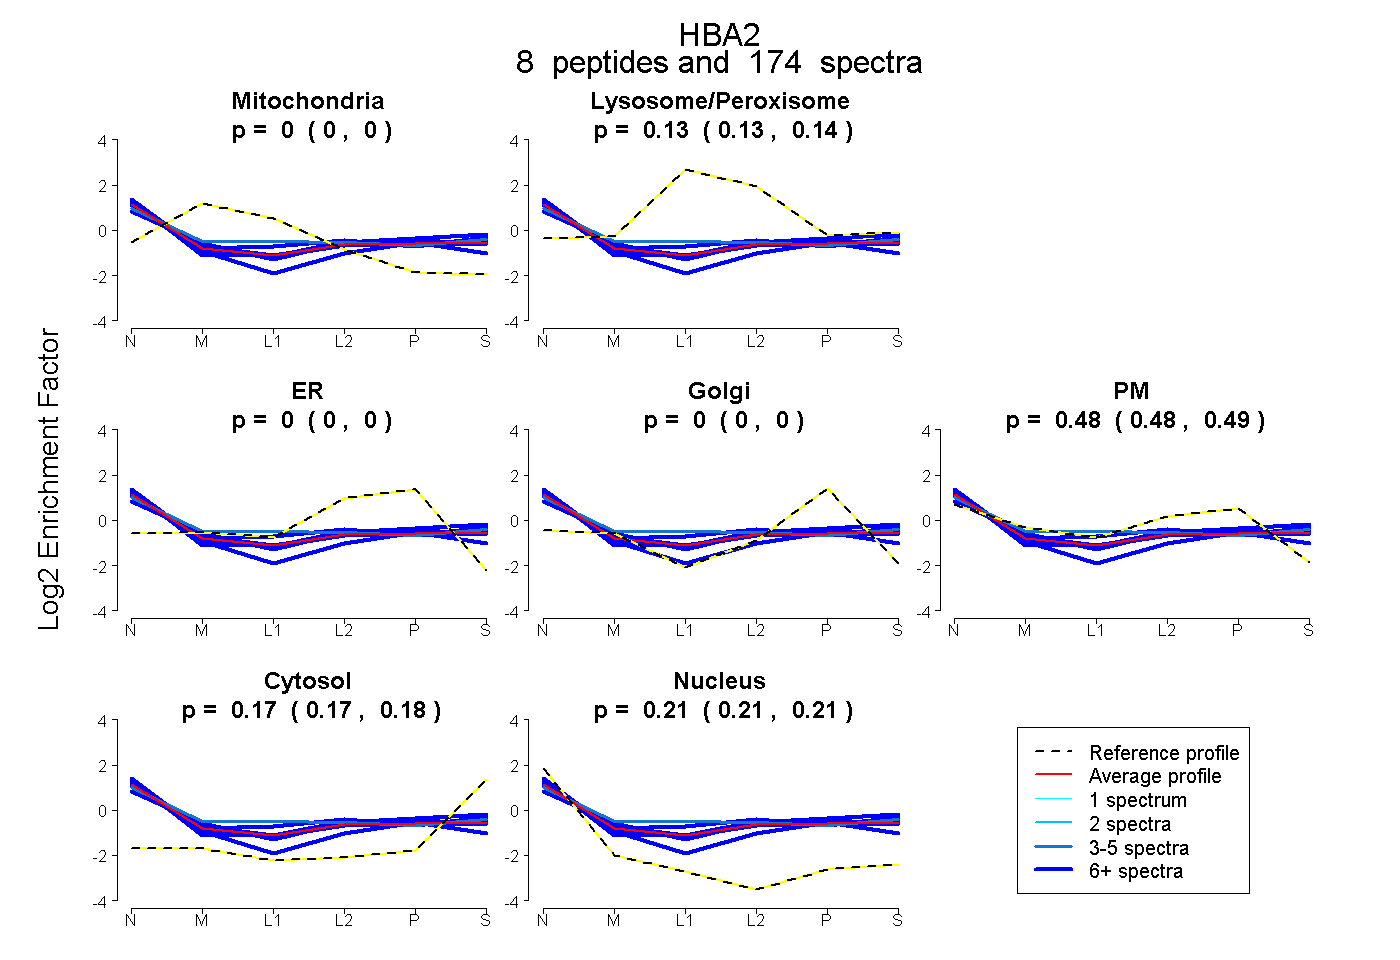
0.000 | 0.000
0.129 | 0.139
0.000 | 0.000
0.000 | 0.000
0.476 | 0.486
0.170 | 0.176
0.207 | 0.212
1peptide
spectra
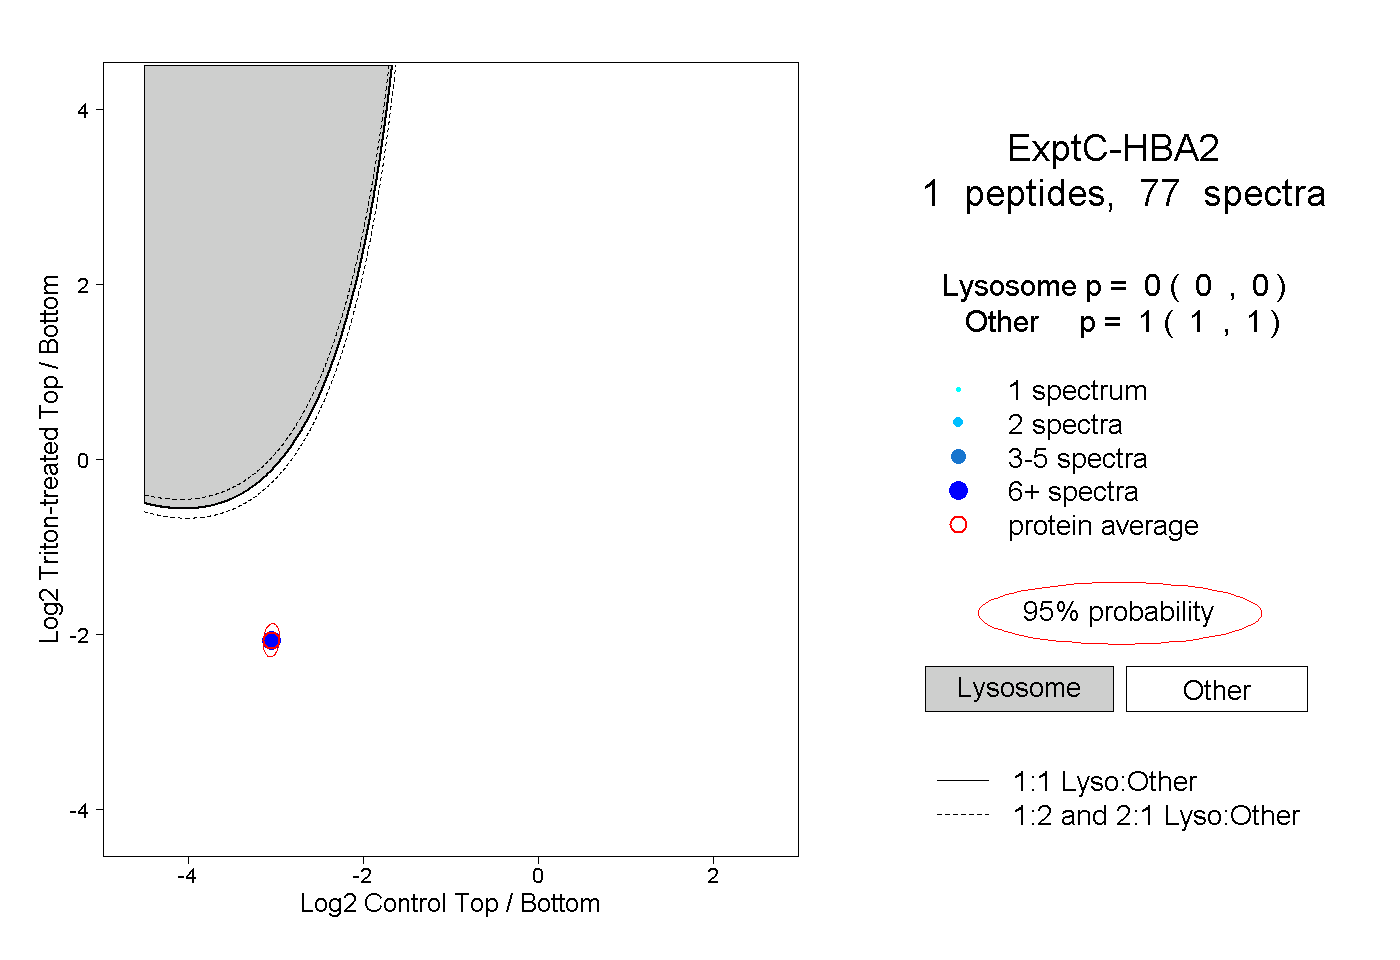
0.000 | 0.000
1.000 | 1.000
7peptides
spectra
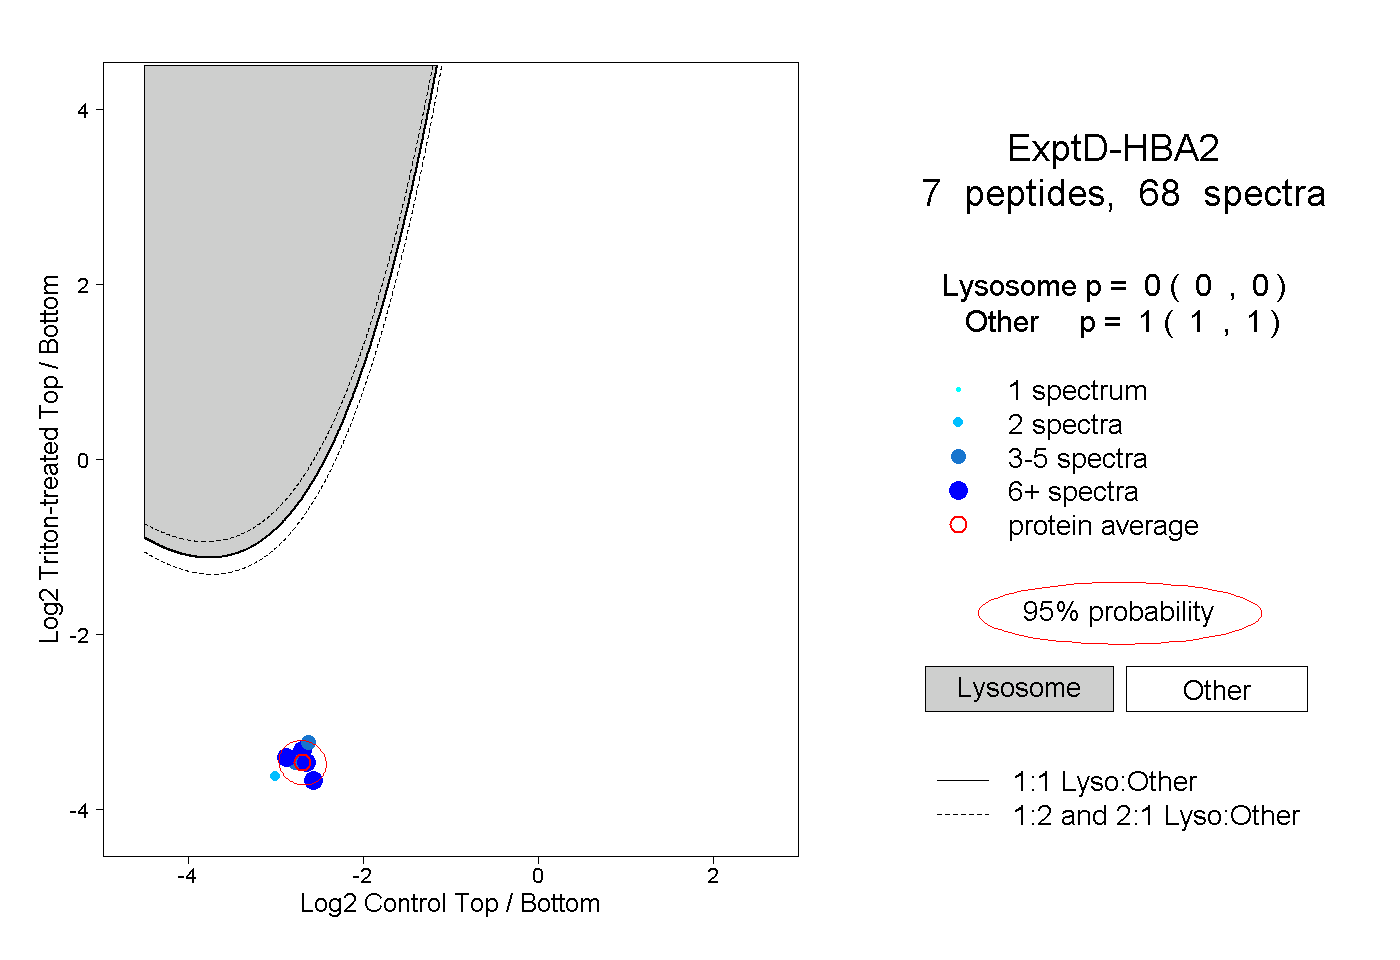
0.000 | 0.000
1.000 | 1.000