 9
9peptides
spectra
0.000 | 0.000
0.000 | 0.000
0.000 | 0.000
0.430 | 0.432
0.000 | 0.000
0.000 | 0.000
0.230 | 0.232
0.337 | 0.339
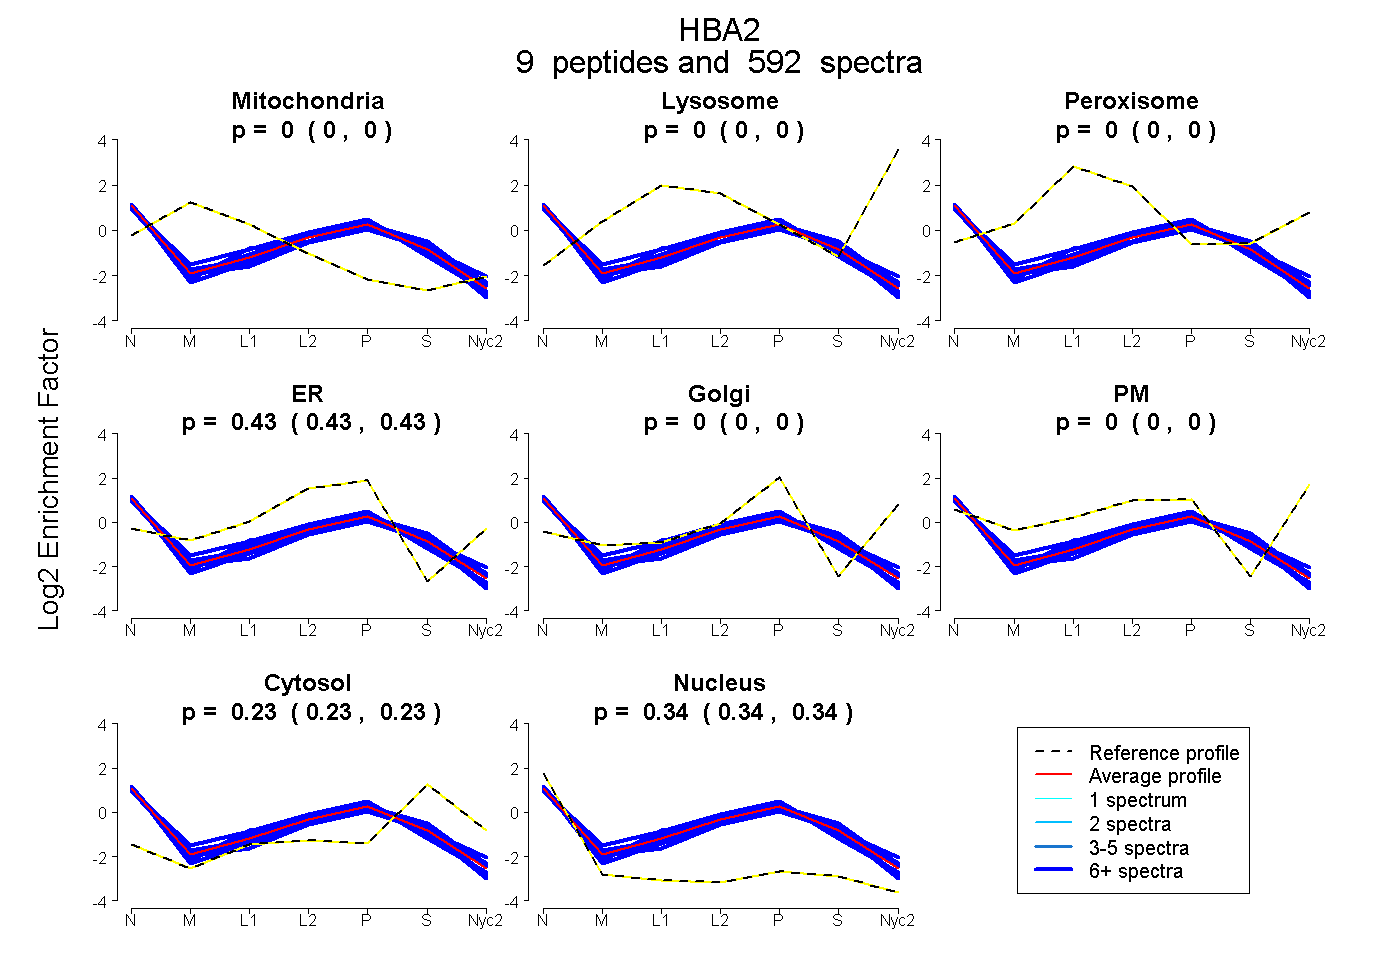
| Plot | Mito | Lyso | Perox | ER | Golgi | PM | Cytosol | Nucleus | |||||
| Expt A |
9 peptides |
592 spectra |
|
0.000 0.000 | 0.000 |
0.000 0.000 | 0.000 |
0.000 0.000 | 0.000 |
0.431 0.430 | 0.432 |
0.000 0.000 | 0.000 |
0.000 0.000 | 0.000 |
0.231 0.230 | 0.232 |
0.338 0.337 | 0.339 |
| 42 spectra, FFASVSTVLTSK | 0.000 | 0.000 | 0.000 | 0.381 | 0.000 | 0.000 | 0.281 | 0.338 | ||
| 85 spectra, VDPVNFK | 0.000 | 0.000 | 0.000 | 0.390 | 0.000 | 0.000 | 0.221 | 0.389 | ||
| 192 spectra, IGGHGGEYGEEALQR | 0.000 | 0.000 | 0.000 | 0.466 | 0.000 | 0.000 | 0.201 | 0.332 | ||
| 8 spectra, AADHVEDLPGALSTLSDLHAHK | 0.000 | 0.000 | 0.000 | 0.419 | 0.000 | 0.000 | 0.302 | 0.279 | ||
| 45 spectra, VLSADDK | 0.000 | 0.000 | 0.000 | 0.365 | 0.000 | 0.000 | 0.250 | 0.384 | ||
| 50 spectra, VLSAADK | 0.000 | 0.000 | 0.000 | 0.485 | 0.000 | 0.000 | 0.151 | 0.364 | ||
| 26 spectra, TYFSHIDVSPGSAQVK | 0.000 | 0.000 | 0.016 | 0.414 | 0.000 | 0.000 | 0.247 | 0.323 | ||
| 97 spectra, VADALAK | 0.000 | 0.000 | 0.000 | 0.426 | 0.000 | 0.000 | 0.281 | 0.293 | ||
| 47 spectra, MFAAFPTTK | 0.000 | 0.000 | 0.028 | 0.485 | 0.000 | 0.000 | 0.156 | 0.331 |
| Plot | Mito | Lyso or Perox | ER | Golgi | PM | Cytosol | Nucleus | ||||||
| Expt B |
8 peptides |
174 spectra |
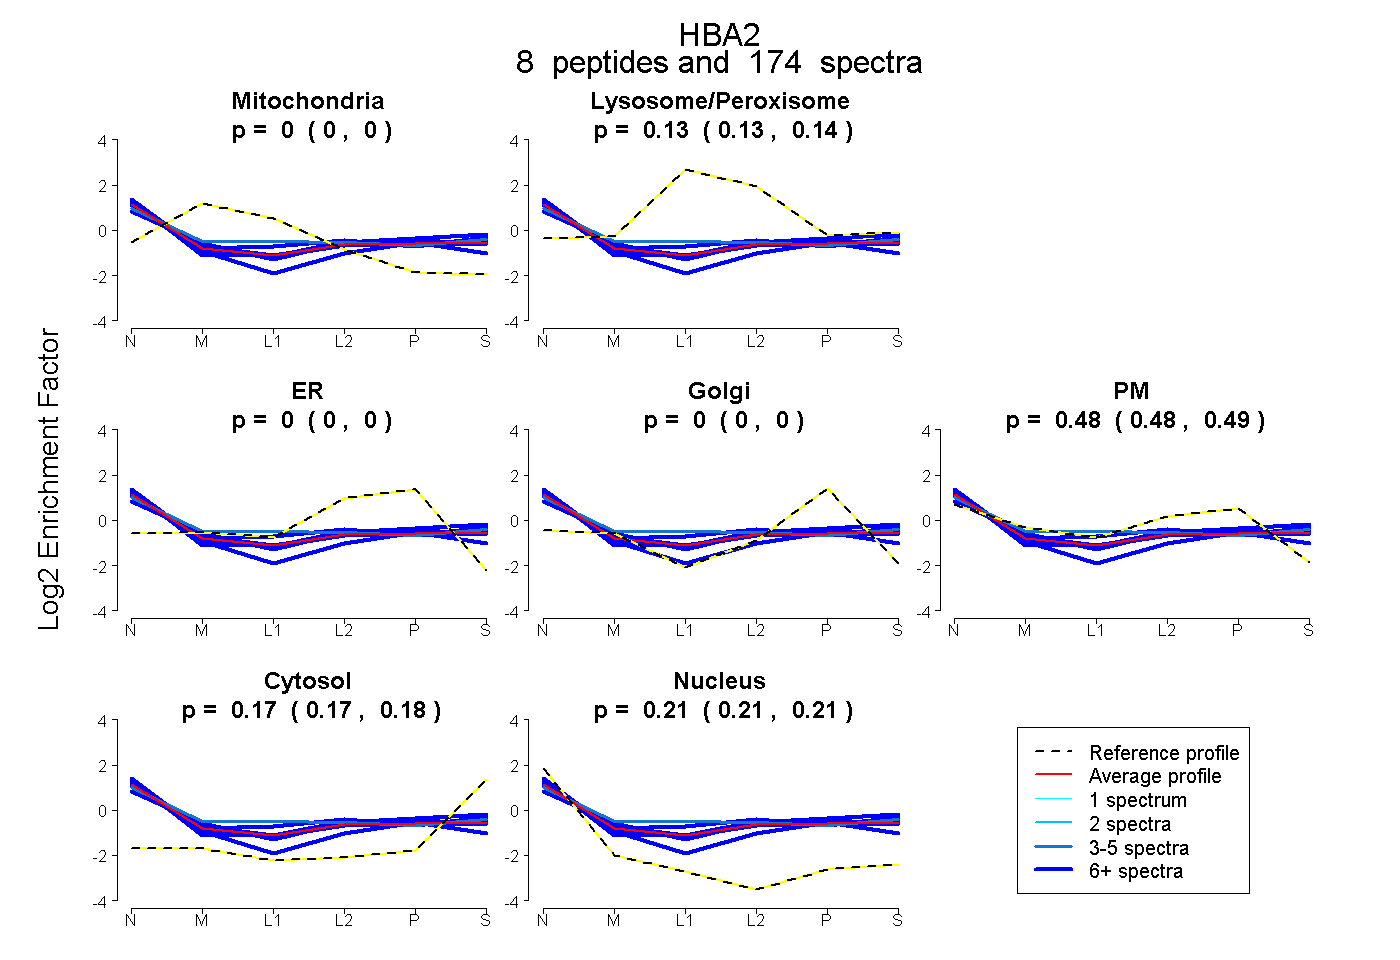 |
0.000 0.000 | 0.000 |
0.135 0.129 | 0.139 |
0.000 0.000 | 0.000 |
0.000 0.000 | 0.000 |
0.482 0.476 | 0.486 |
0.173 0.170 | 0.176 |
0.210 0.207 | 0.212 |
|||
| Plot | Lyso | Other | |||||||||||
| Expt C |
1 peptide |
77 spectra |
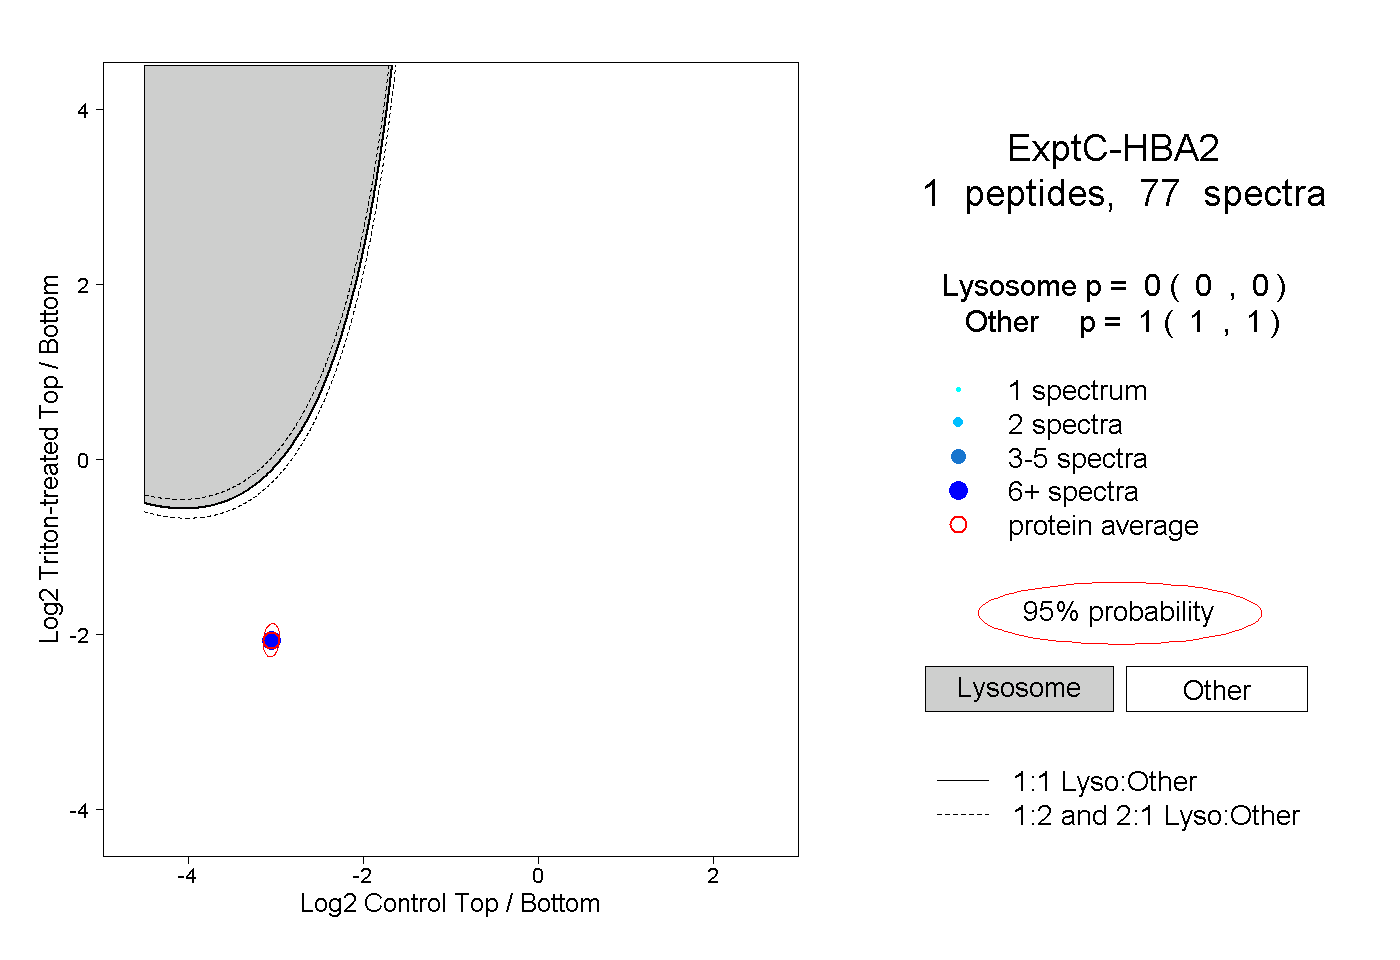 |
0.000 0.000 | 0.000 |
1.000 1.000 | 1.000 |
||||||||
| Plot | Lyso | Other | |||||||||||
| Expt D |
7 peptides |
68 spectra |
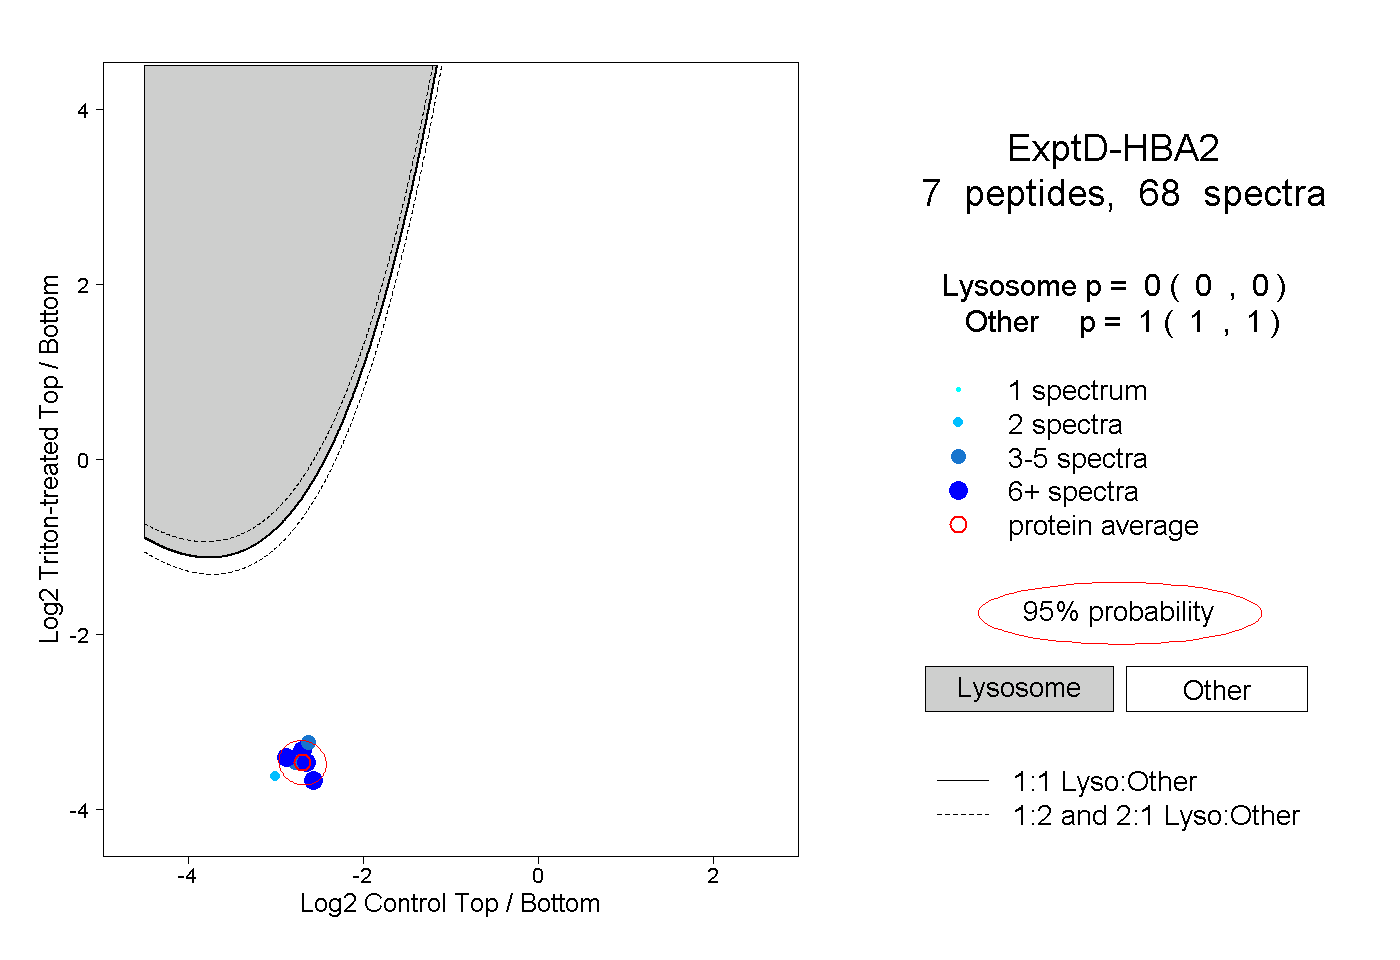 |
0.000 0.000 | 0.000 |
1.000 1.000 | 1.000 |