 18
18peptides
spectra
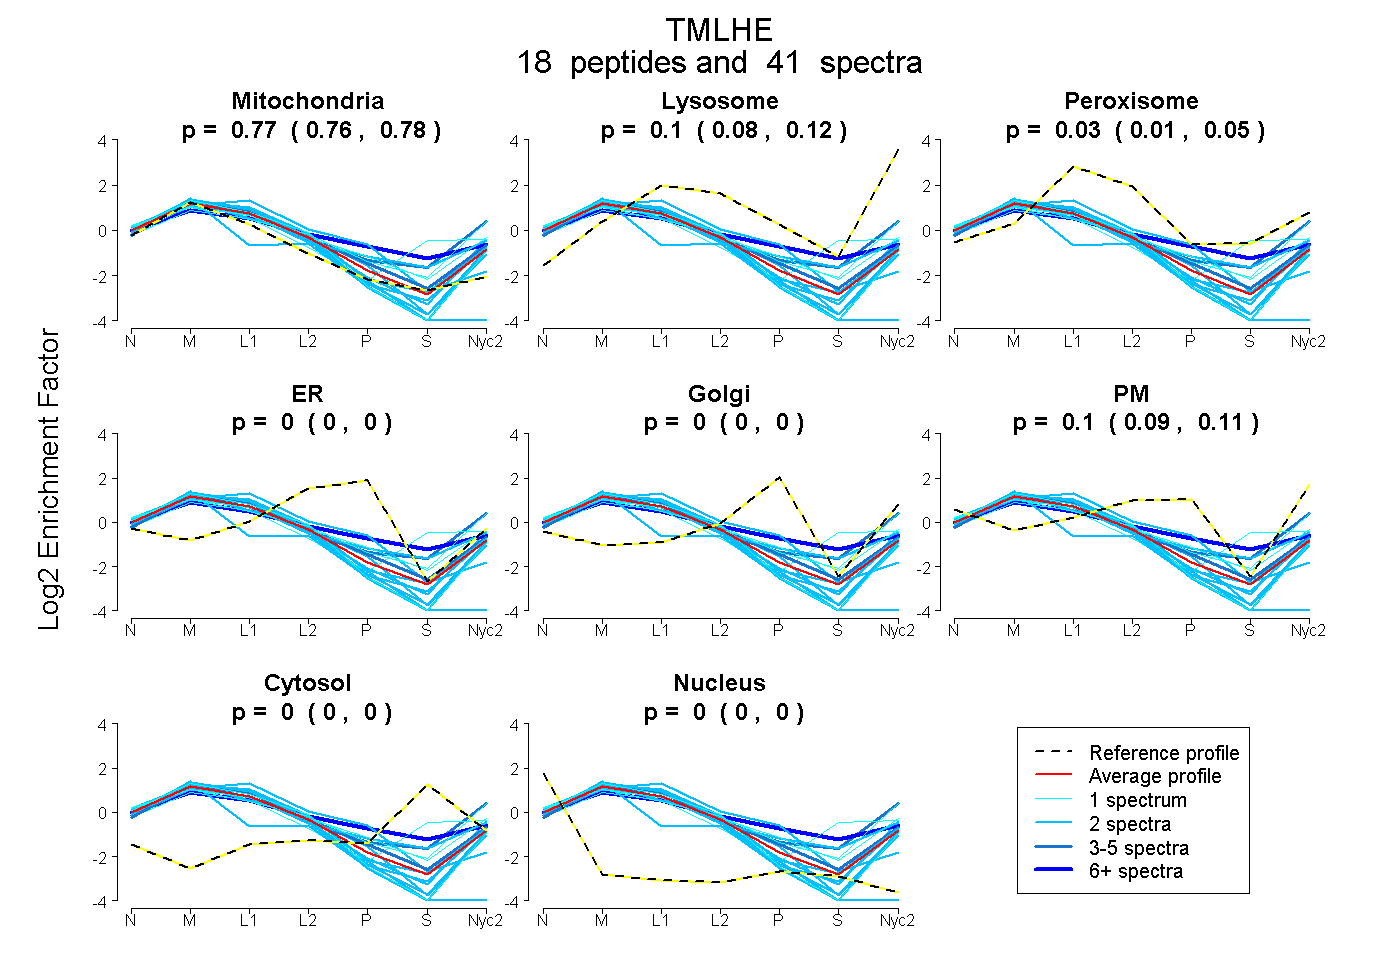
0.761 | 0.776
0.080 | 0.116
0.012 | 0.048
0.000 | 0.000
0.000 | 0.000
0.088 | 0.109
0.000 | 0.000
0.000 | 0.000
6peptides
spectra
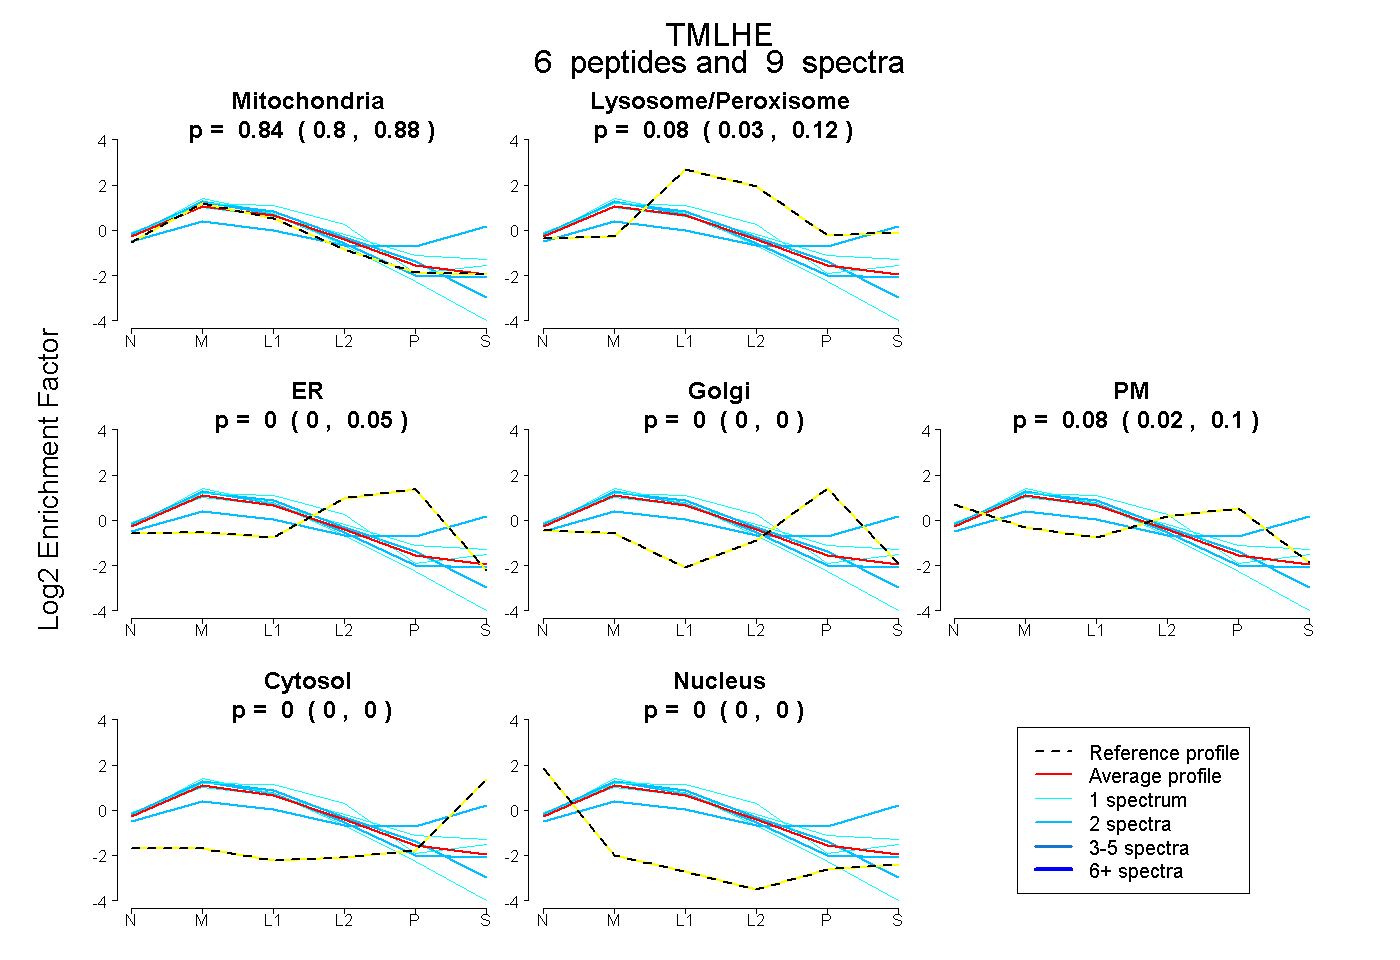
0.799 | 0.879
0.028 | 0.120
0.000 | 0.053
0.000 | 0.000
0.018 | 0.101
0.000 | 0.000
0.000 | 0.000
23peptides
spectra
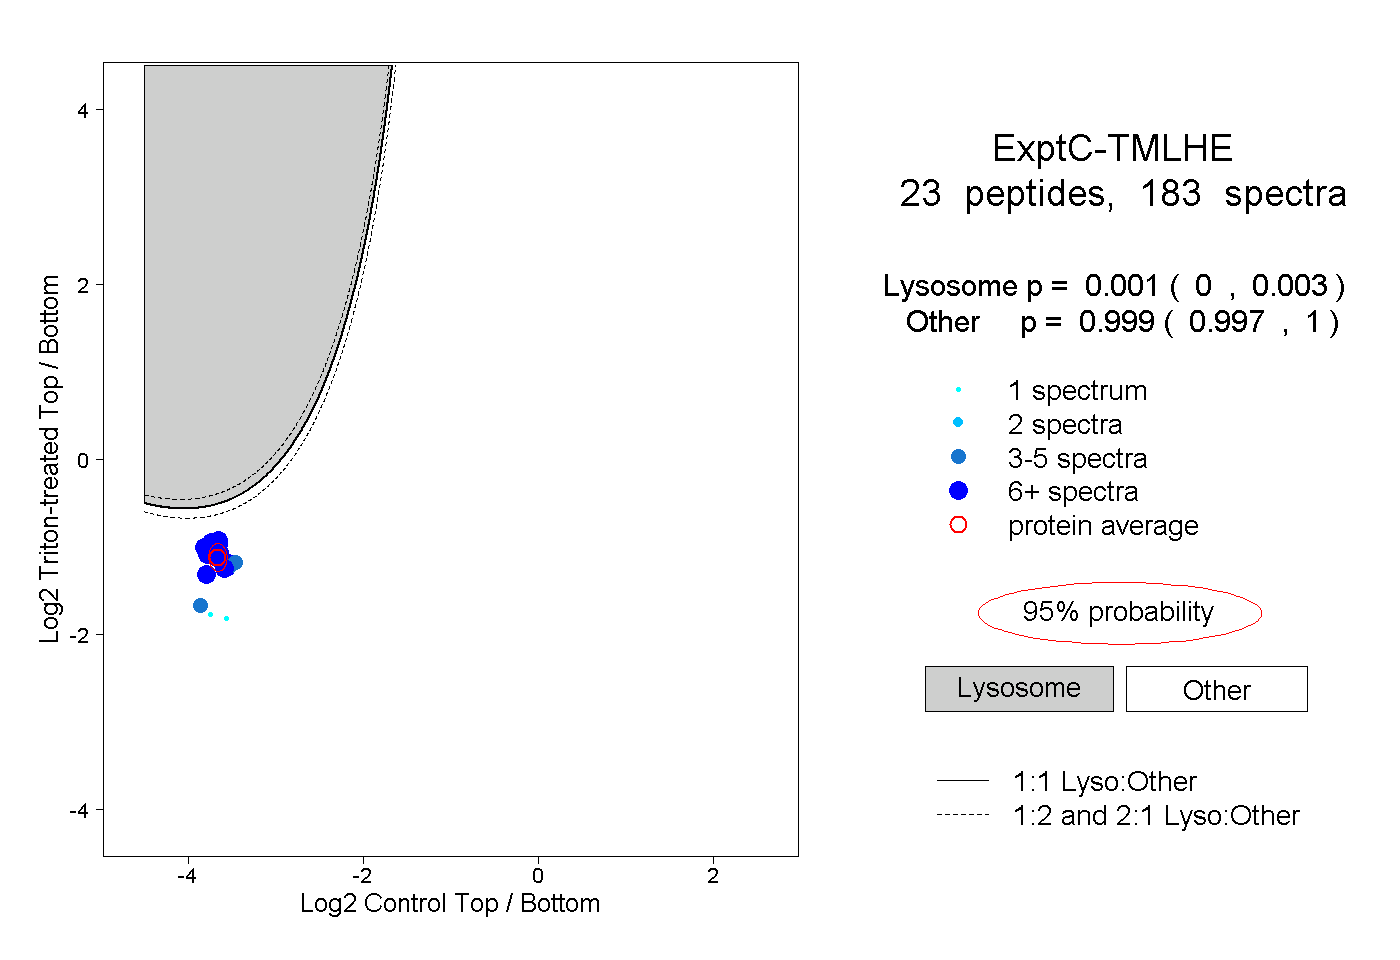
0.000 | 0.003
0.997 | 1.000
8peptides
spectra
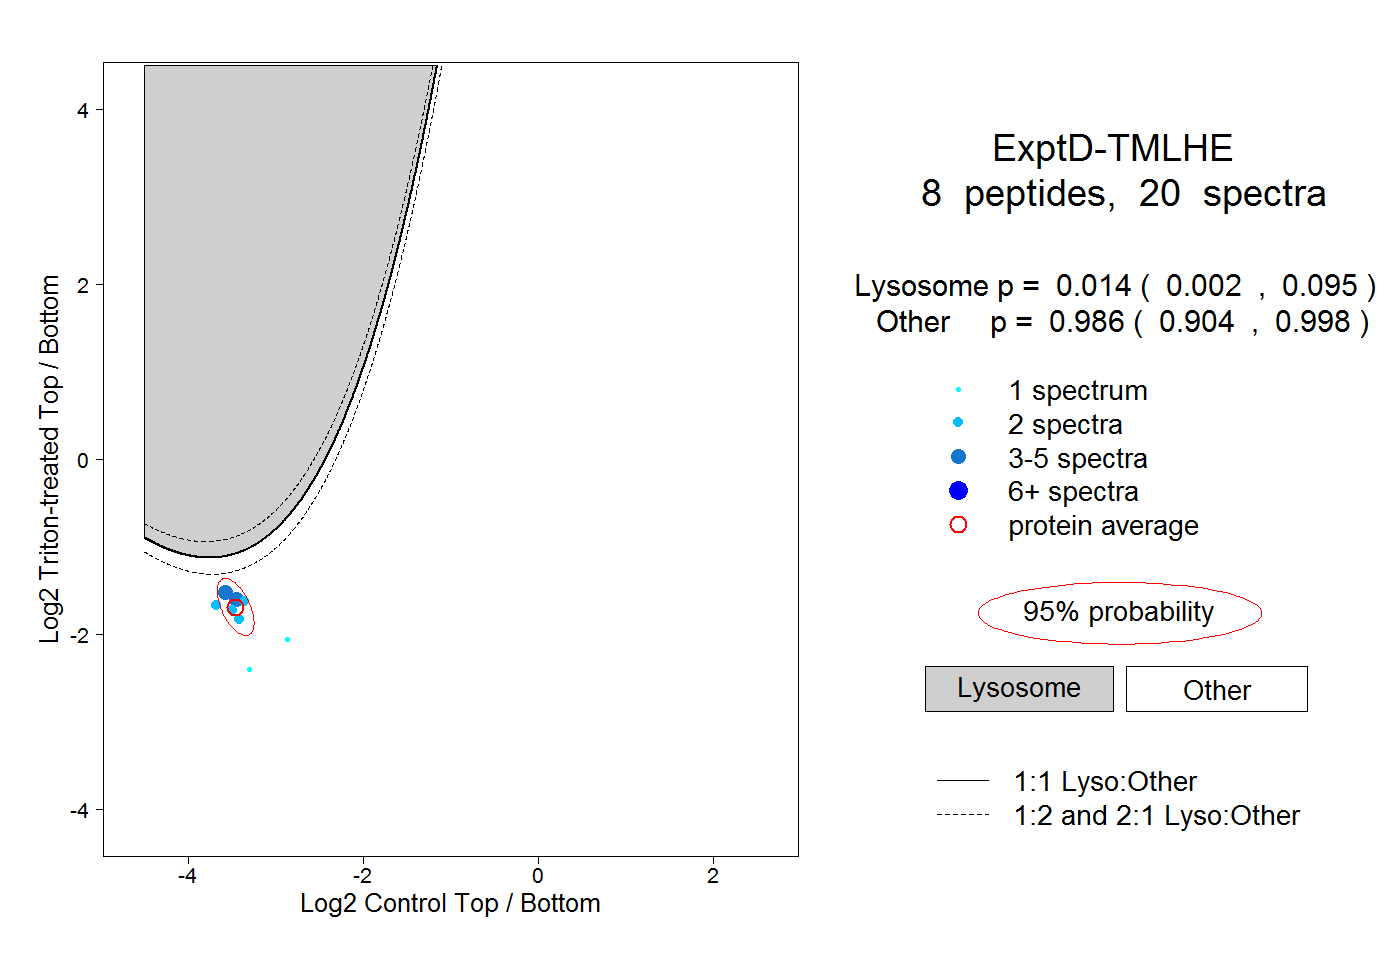
0.002 | 0.095
0.904 | 0.998