 7
7peptides
spectra
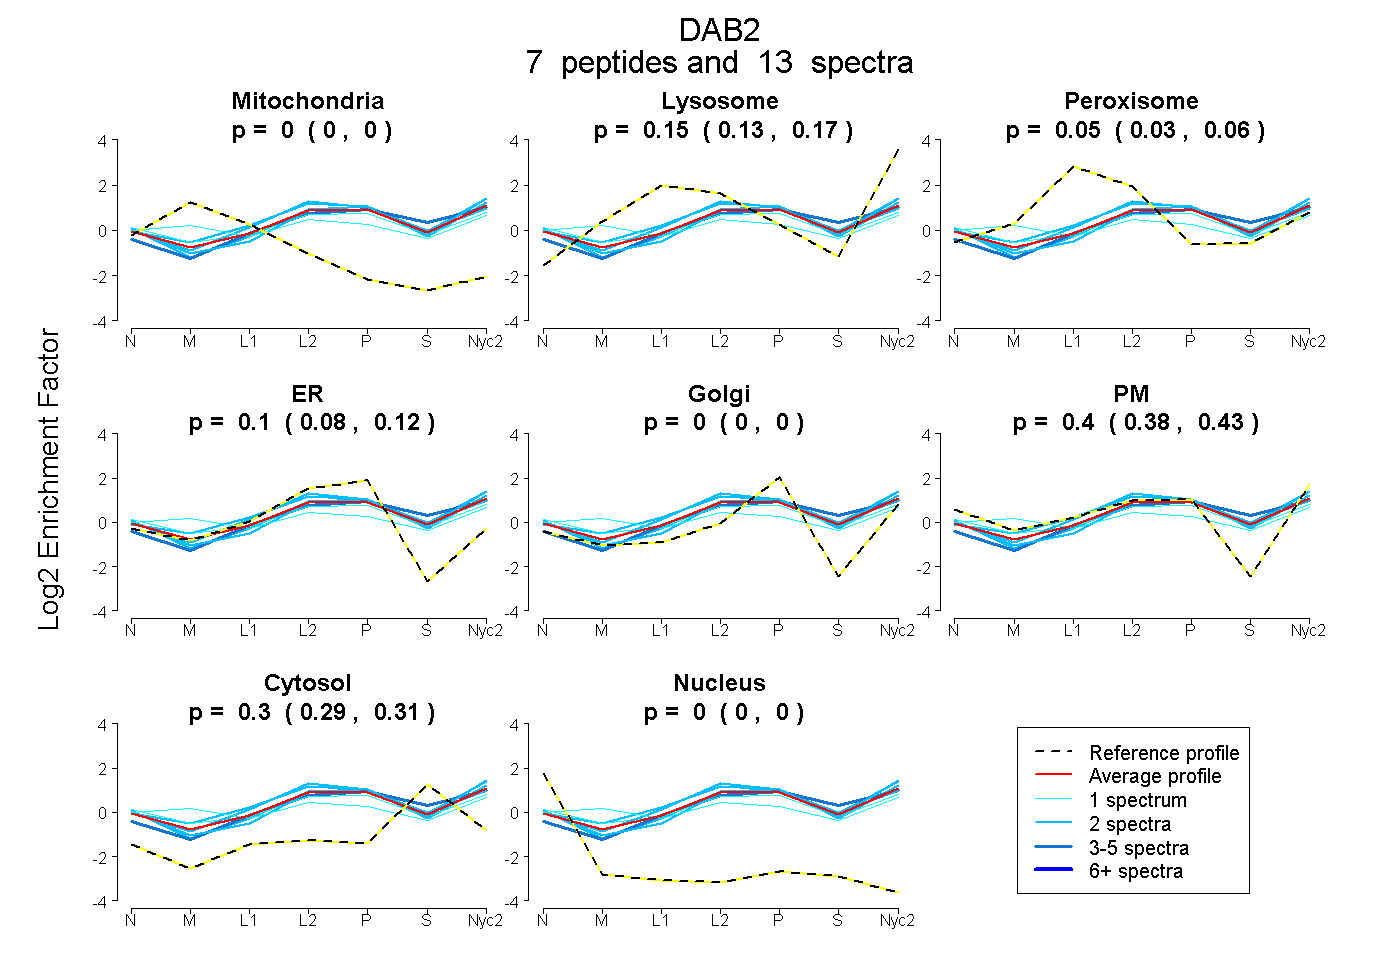
0.000 | 0.000
0.132 | 0.166
0.025 | 0.062
0.078 | 0.120
0.000 | 0.000
0.379 | 0.426
0.290 | 0.307
0.000 | 0.000
2peptides
spectra
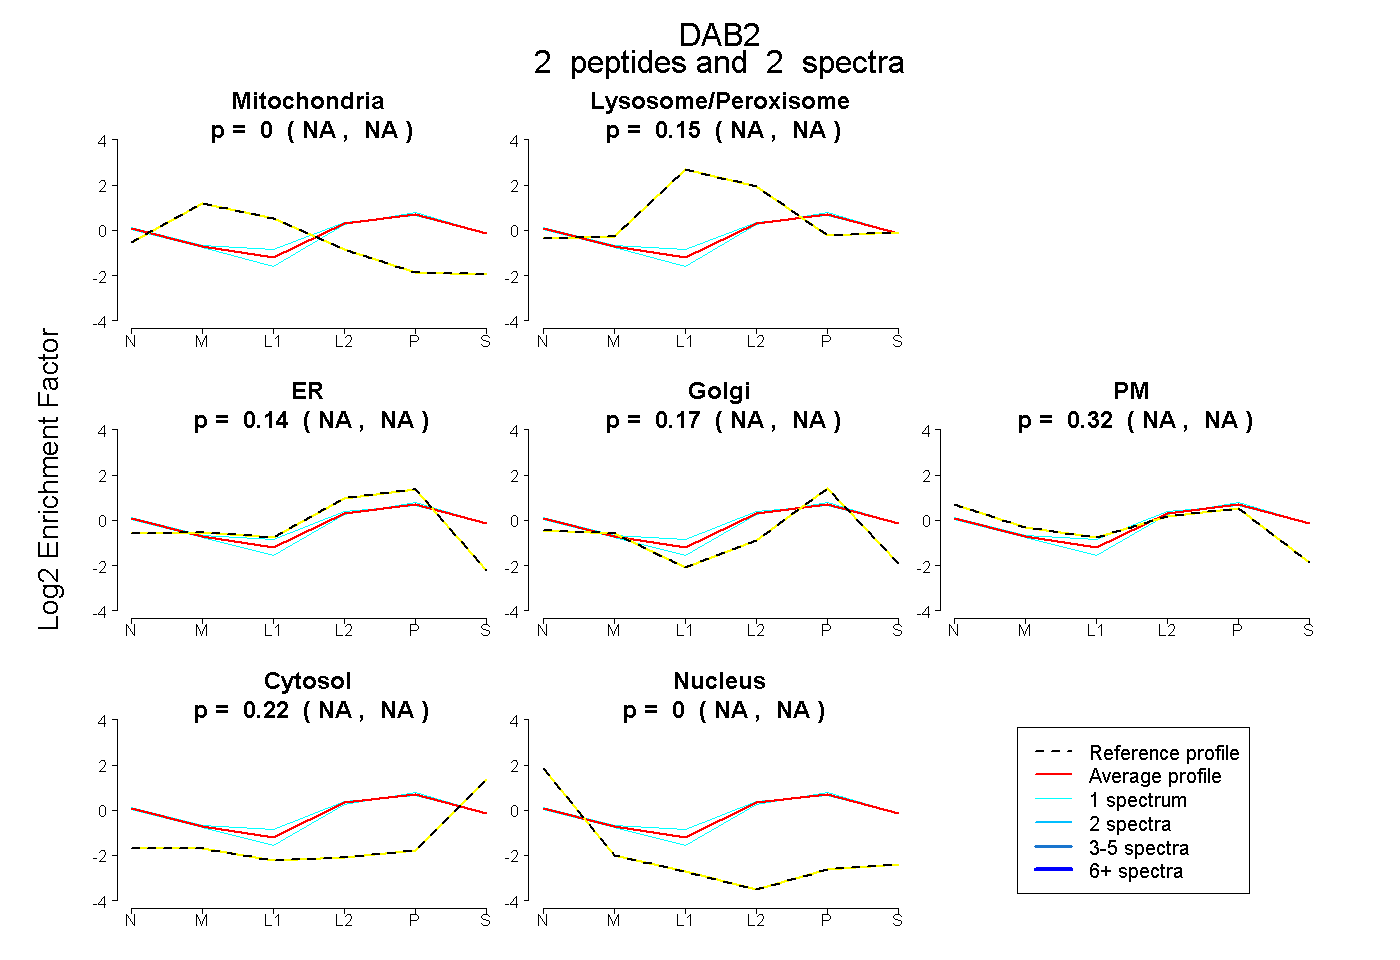
NA | NA
NA | NA
NA | NA
NA | NA
NA | NA
NA | NA
NA | NA
10peptides
spectra
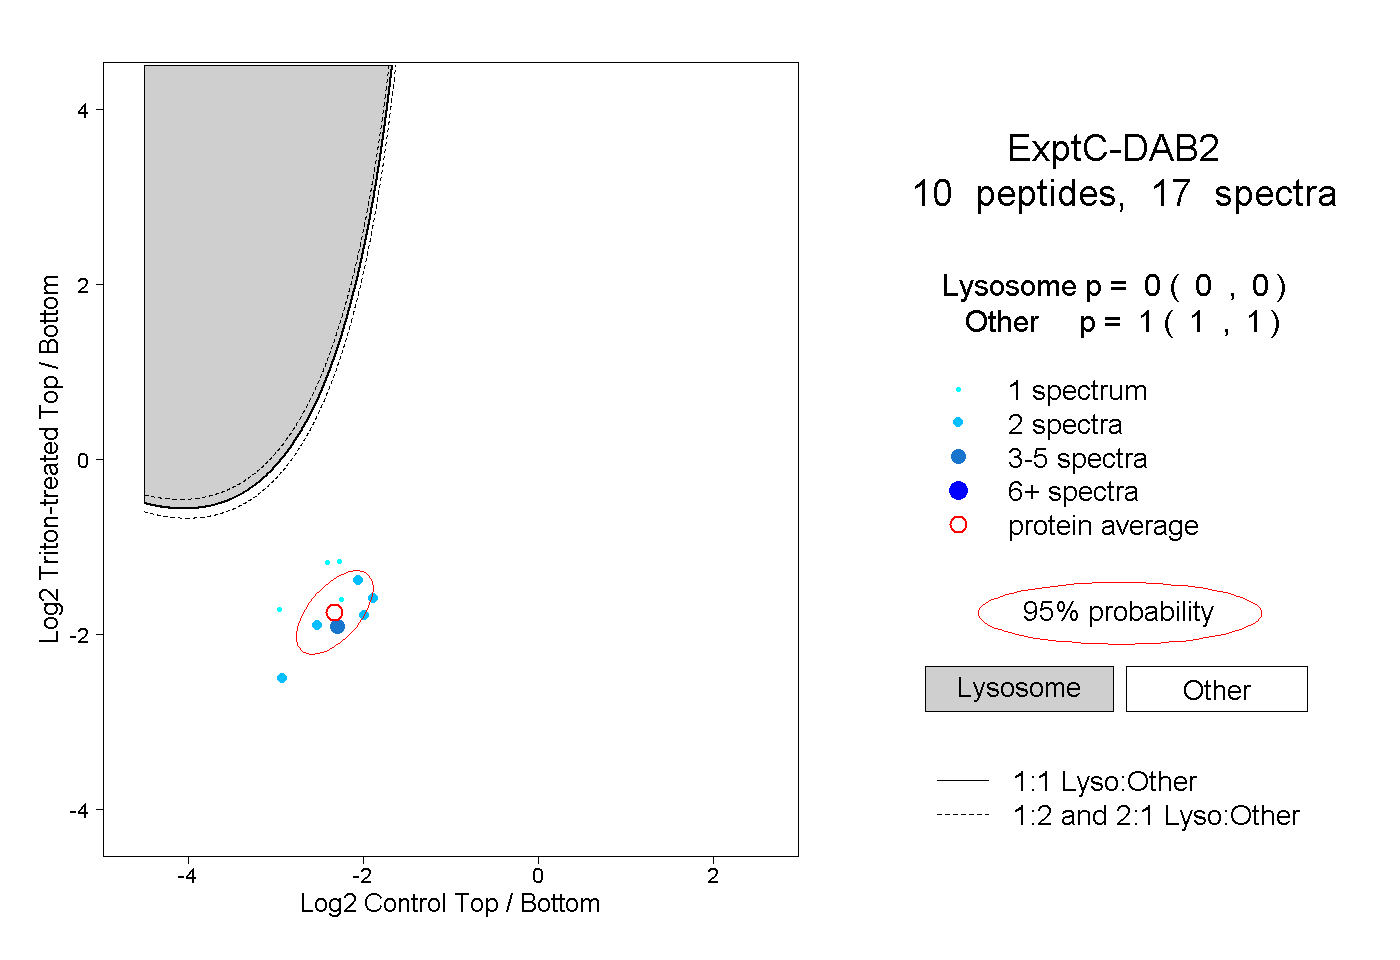
0.000 | 0.000
1.000 | 1.000
2peptides
spectra
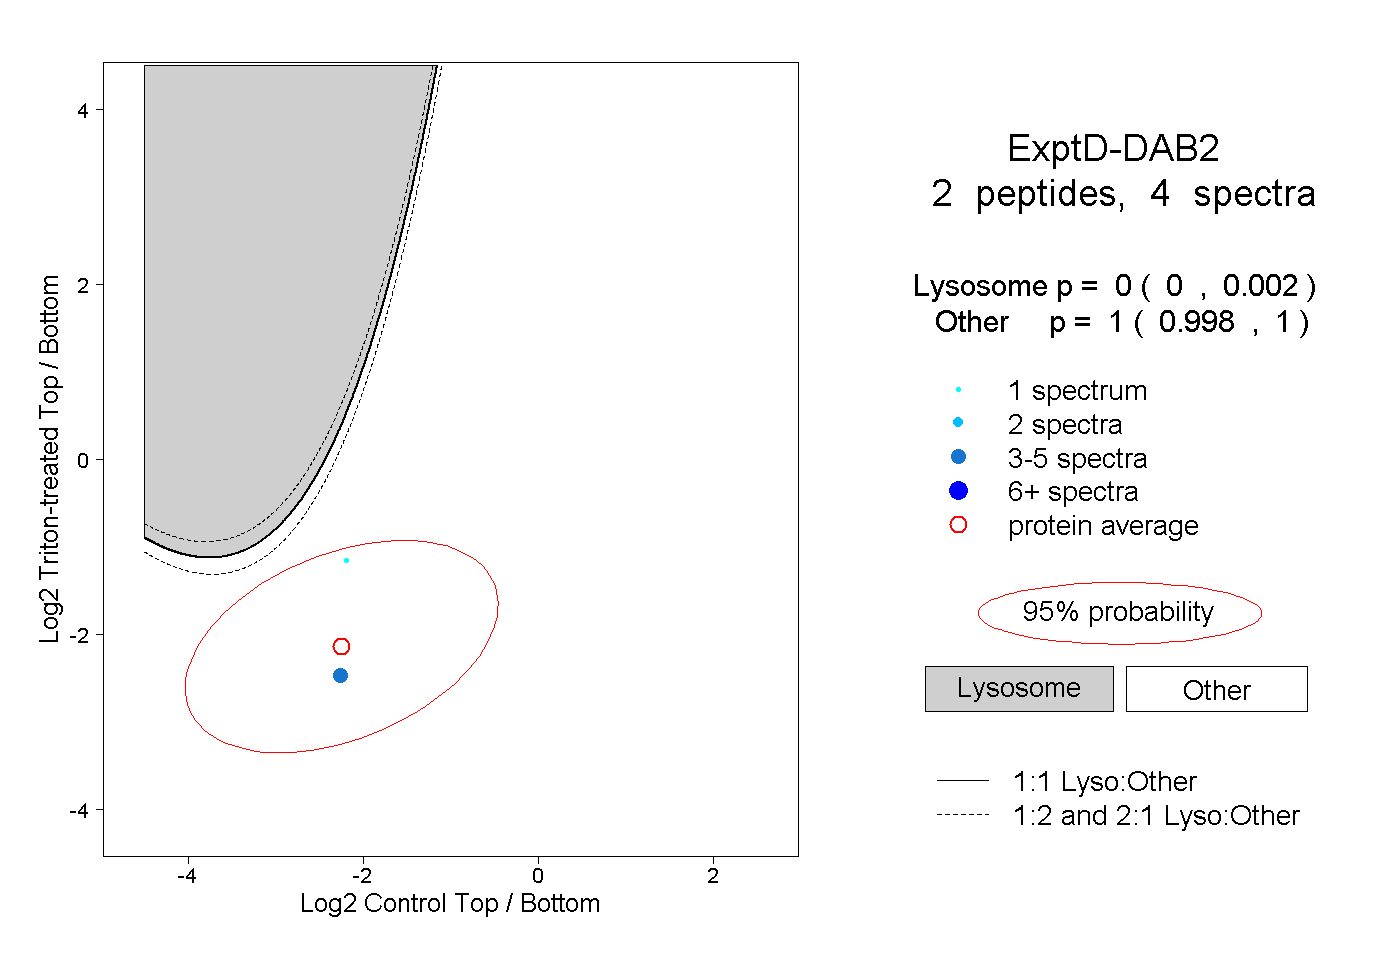
0.000 | 0.002
0.998 | 1.000