 3
3peptides
spectra
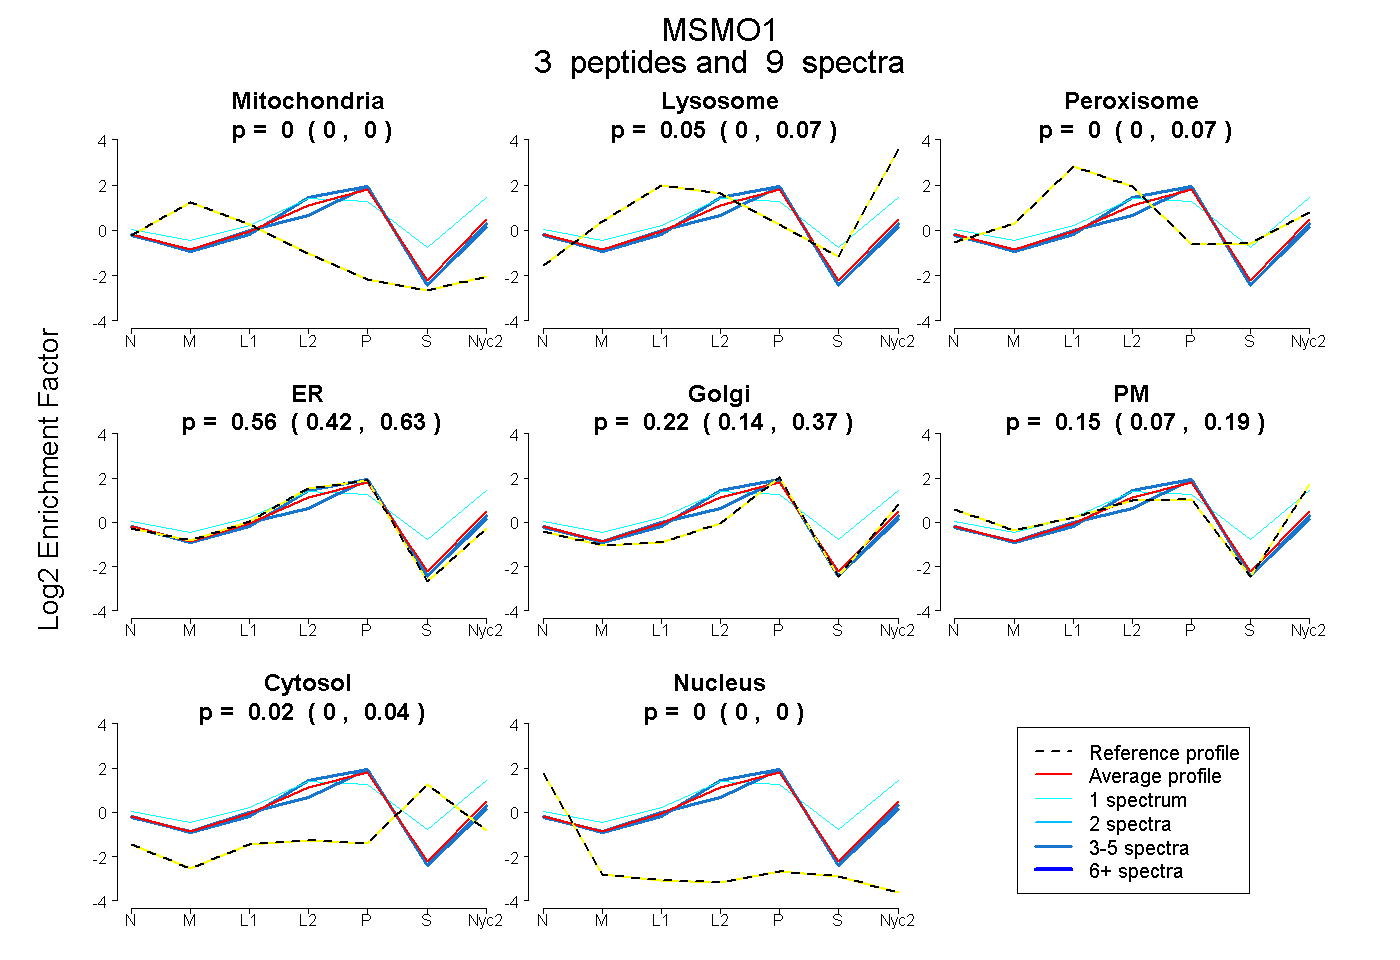
0.000 | 0.000
0.000 | 0.072
0.000 | 0.072
0.421 | 0.631
0.138 | 0.368
0.073 | 0.190
0.000 | 0.042
0.000 | 0.000
1peptide
spectra
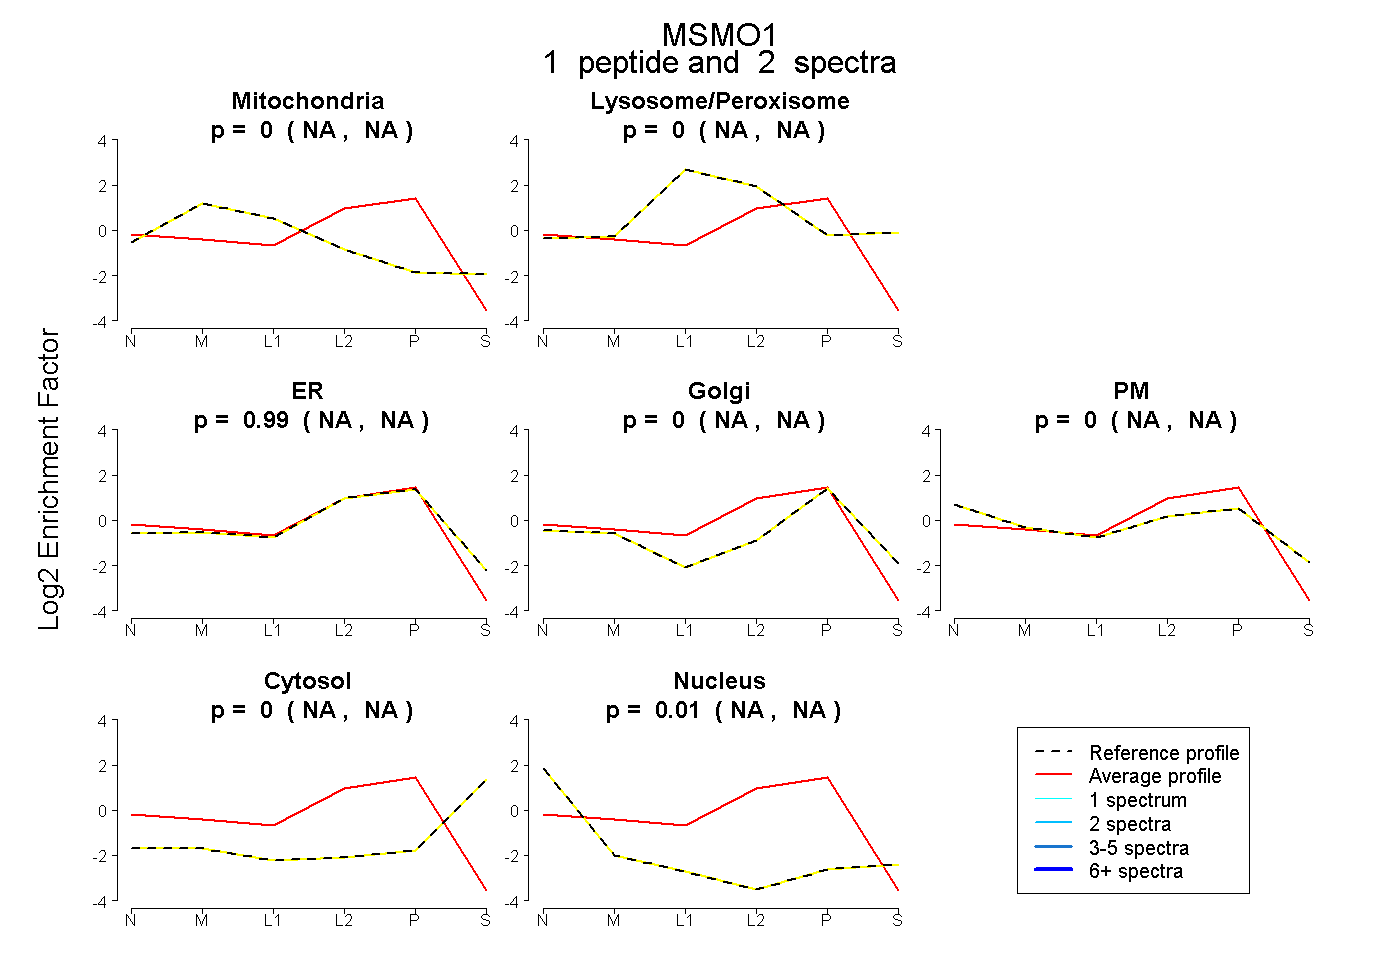
NA | NA
NA | NA
NA | NA
NA | NA
NA | NA
NA | NA
NA | NA
3peptides
spectra
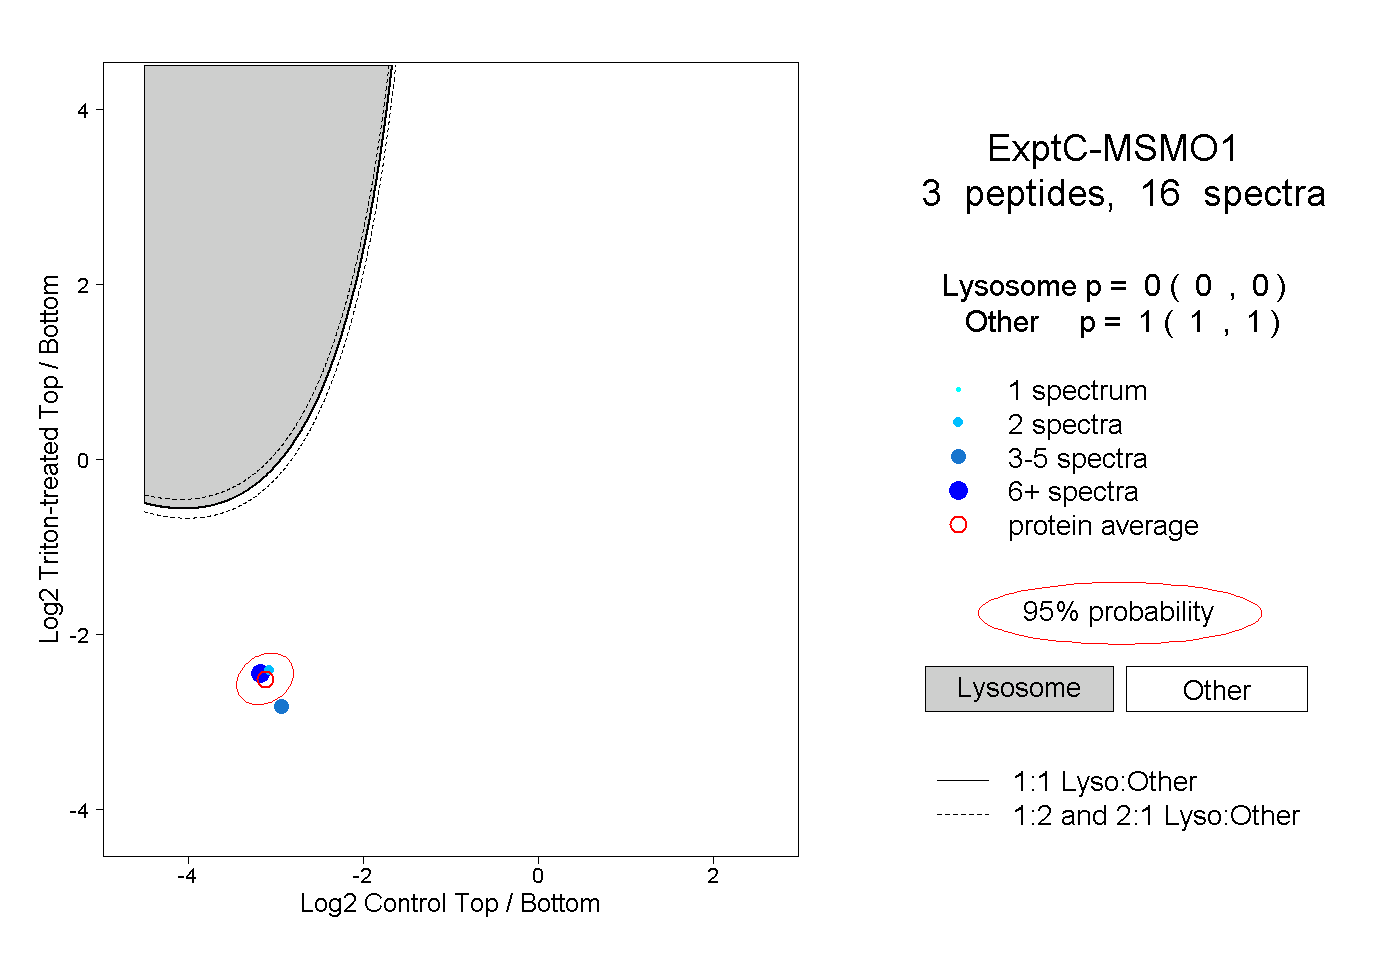
0.000 | 0.000
1.000 | 1.000