 3
3peptides
spectra
0.000 | 0.000
0.000 | 0.072
0.000 | 0.072
0.421 | 0.631
0.138 | 0.368
0.073 | 0.190
0.000 | 0.042
0.000 | 0.000
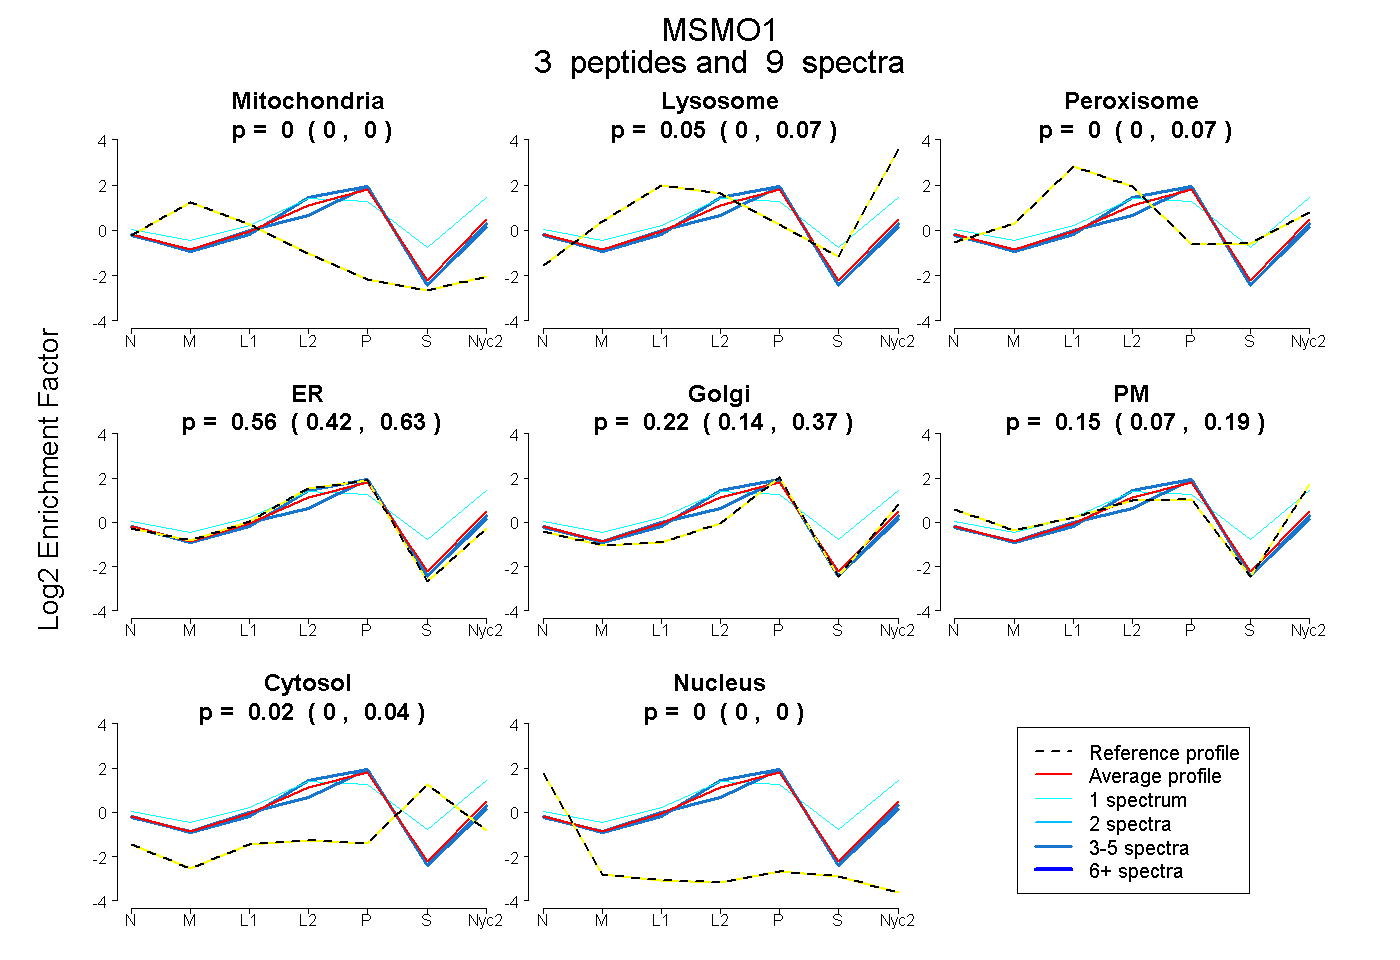
| Plot | Mito | Lyso | Perox | ER | Golgi | PM | Cytosol | Nucleus | |||||
| Expt A |
3 peptides |
9 spectra |
|
0.000 0.000 | 0.000 |
0.047 0.000 | 0.072 |
0.000 0.000 | 0.072 |
0.556 0.421 | 0.631 |
0.224 0.138 | 0.368 |
0.151 0.073 | 0.190 |
0.021 0.000 | 0.042 |
0.000 0.000 | 0.000 |
| 1 spectrum, NAWVYMLDNYTK | 0.000 | 0.221 | 0.037 | 0.214 | 0.000 | 0.398 | 0.130 | 0.000 | ||
| 4 spectra, IFGTDVQYHAYTEK | 0.000 | 0.016 | 0.000 | 0.711 | 0.161 | 0.112 | 0.000 | 0.000 | ||
| 4 spectra, WYFTLAR | 0.000 | 0.000 | 0.057 | 0.502 | 0.430 | 0.000 | 0.000 | 0.010 |
| Plot | Mito | Lyso or Perox | ER | Golgi | PM | Cytosol | Nucleus | ||||||
| Expt B |
1 peptide |
2 spectra |
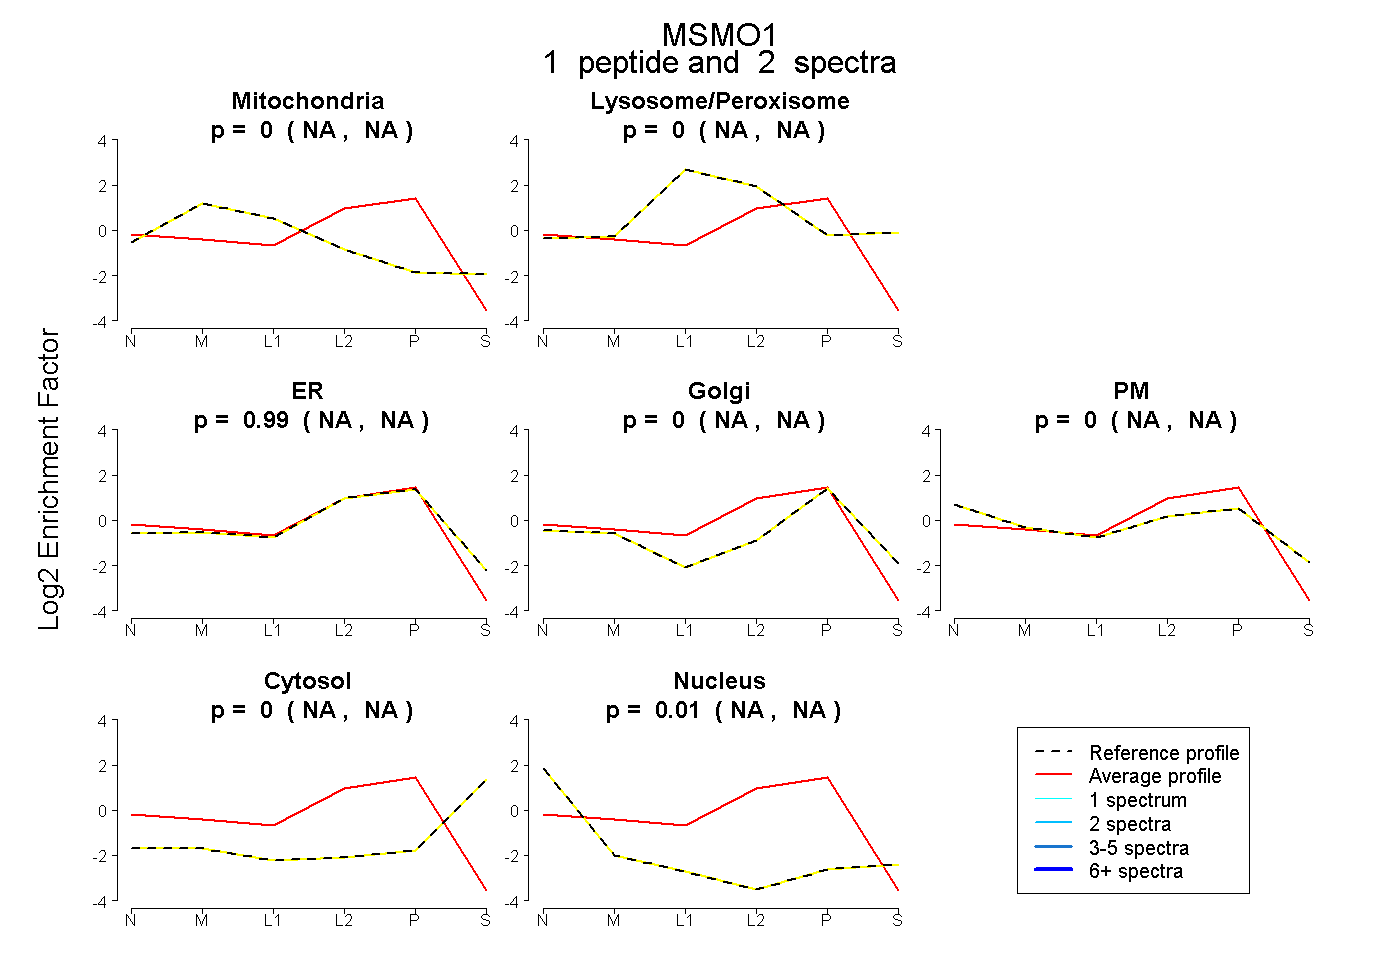 |
0.000 NA | NA |
0.000 NA | NA |
0.987 NA | NA |
0.000 NA | NA |
0.000 NA | NA |
0.000 NA | NA |
0.013 NA | NA |
|||
| Plot | Lyso | Other | |||||||||||
| Expt C |
3 peptides |
16 spectra |
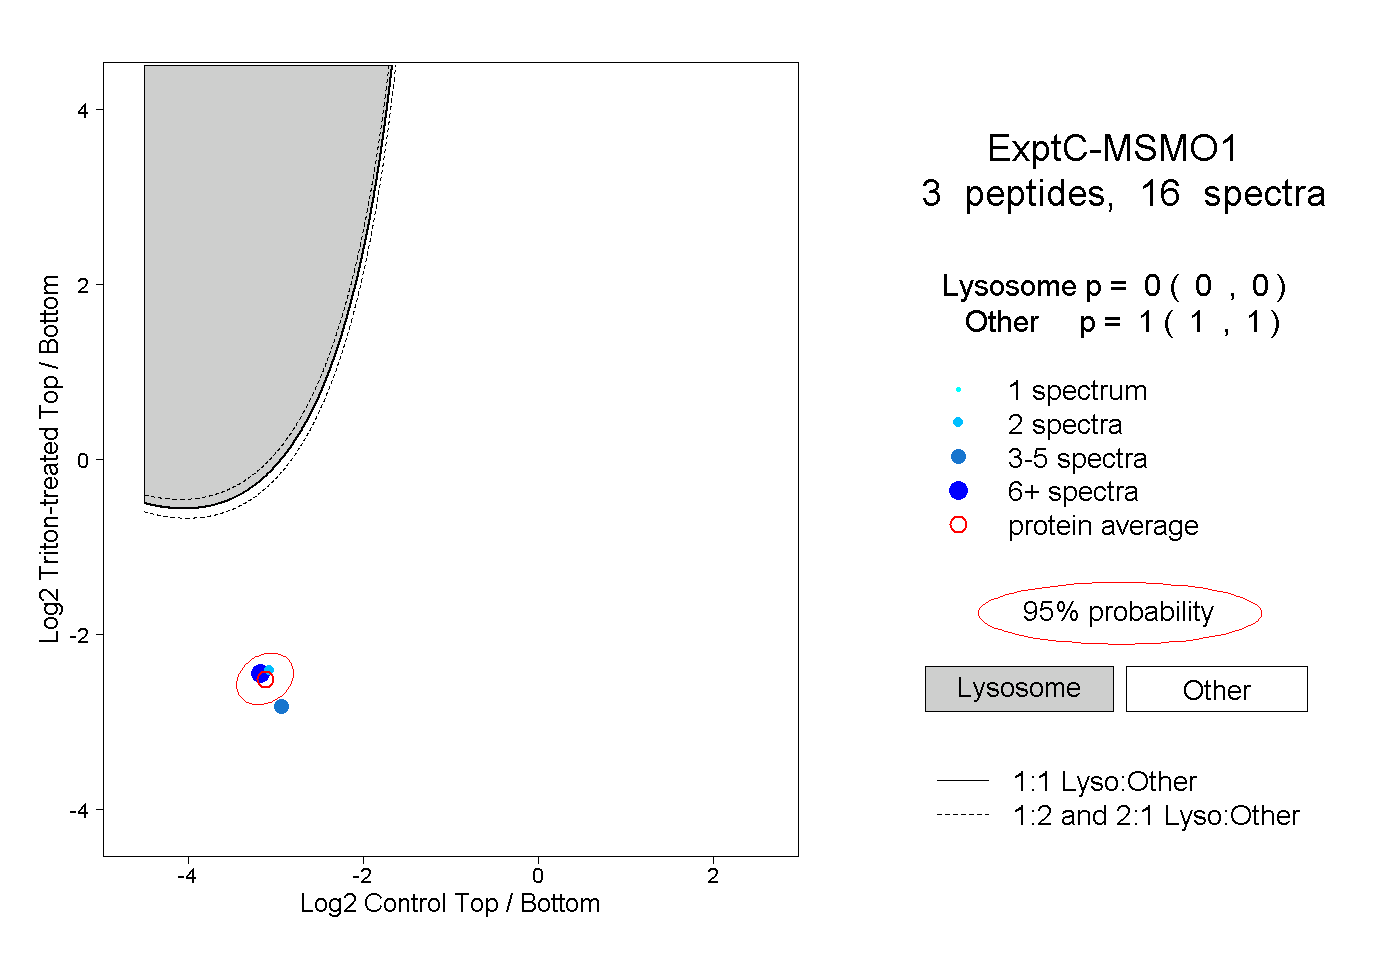 |
0.000 0.000 | 0.000 |
1.000 1.000 | 1.000 |