 11
11peptides
spectra
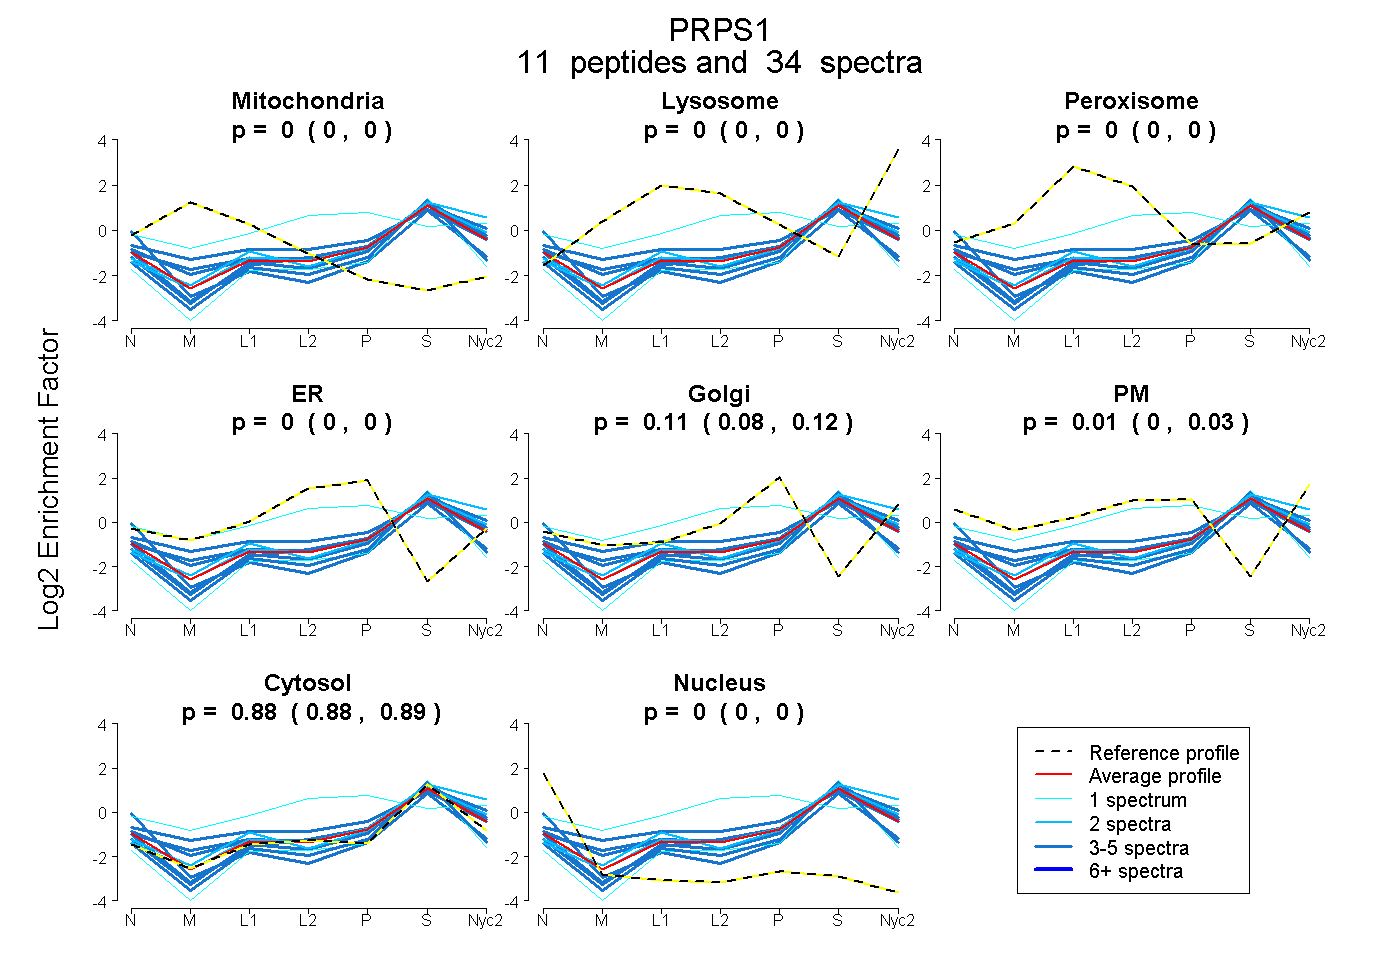
0.000 | 0.000
0.000 | 0.000
0.000 | 0.000
0.000 | 0.000
0.083 | 0.120
0.000 | 0.027
0.876 | 0.891
0.000 | 0.000
3peptides
spectra
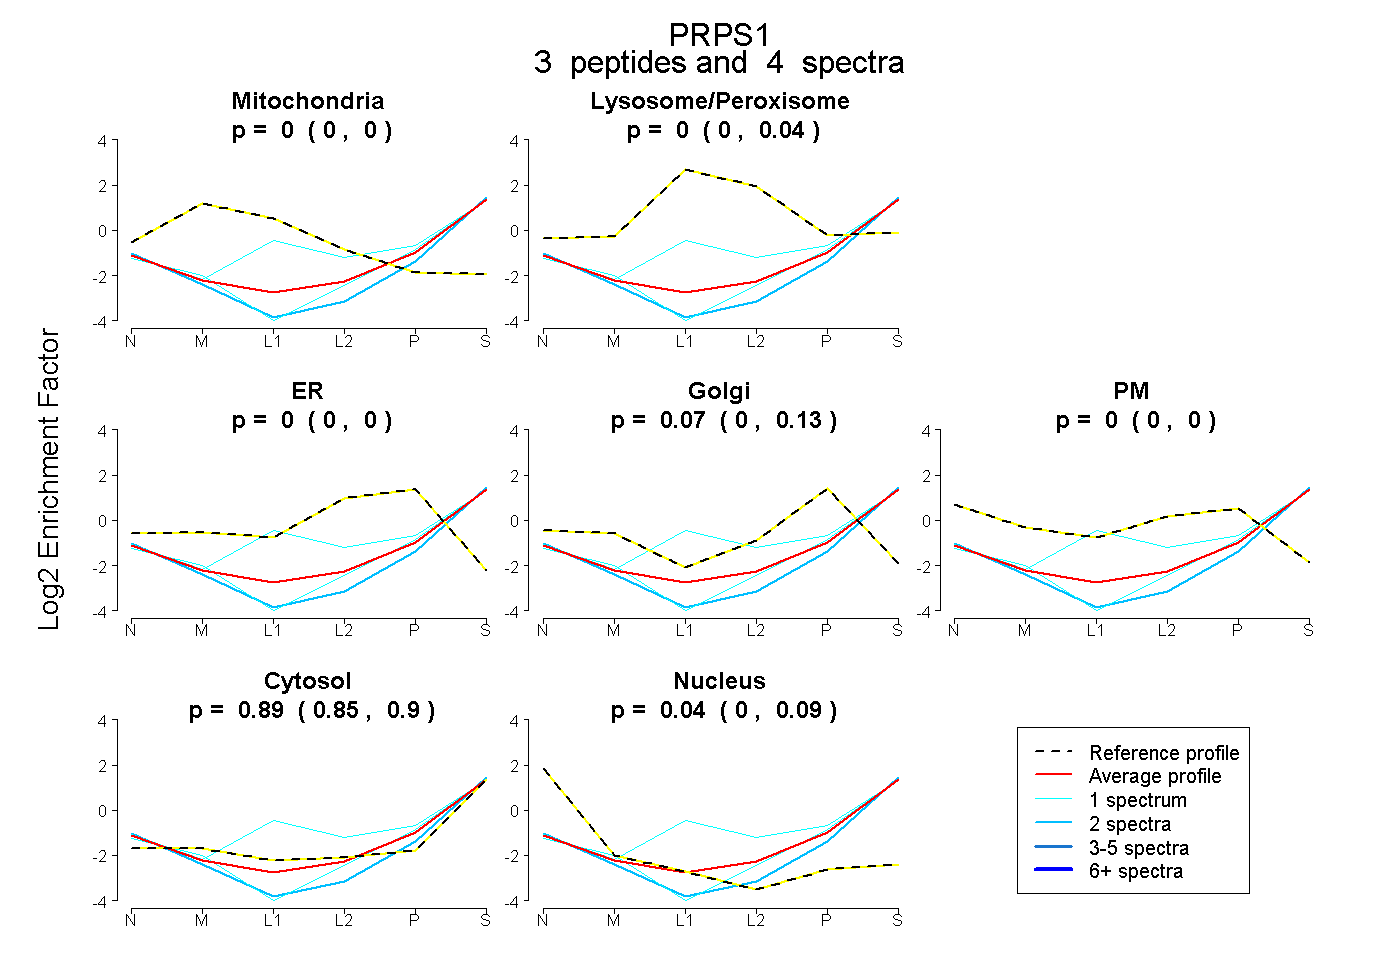
0.000 | 0.000
0.000 | 0.037
0.000 | 0.000
0.003 | 0.126
0.000 | 0.000
0.854 | 0.902
0.000 | 0.090
10peptides
spectra
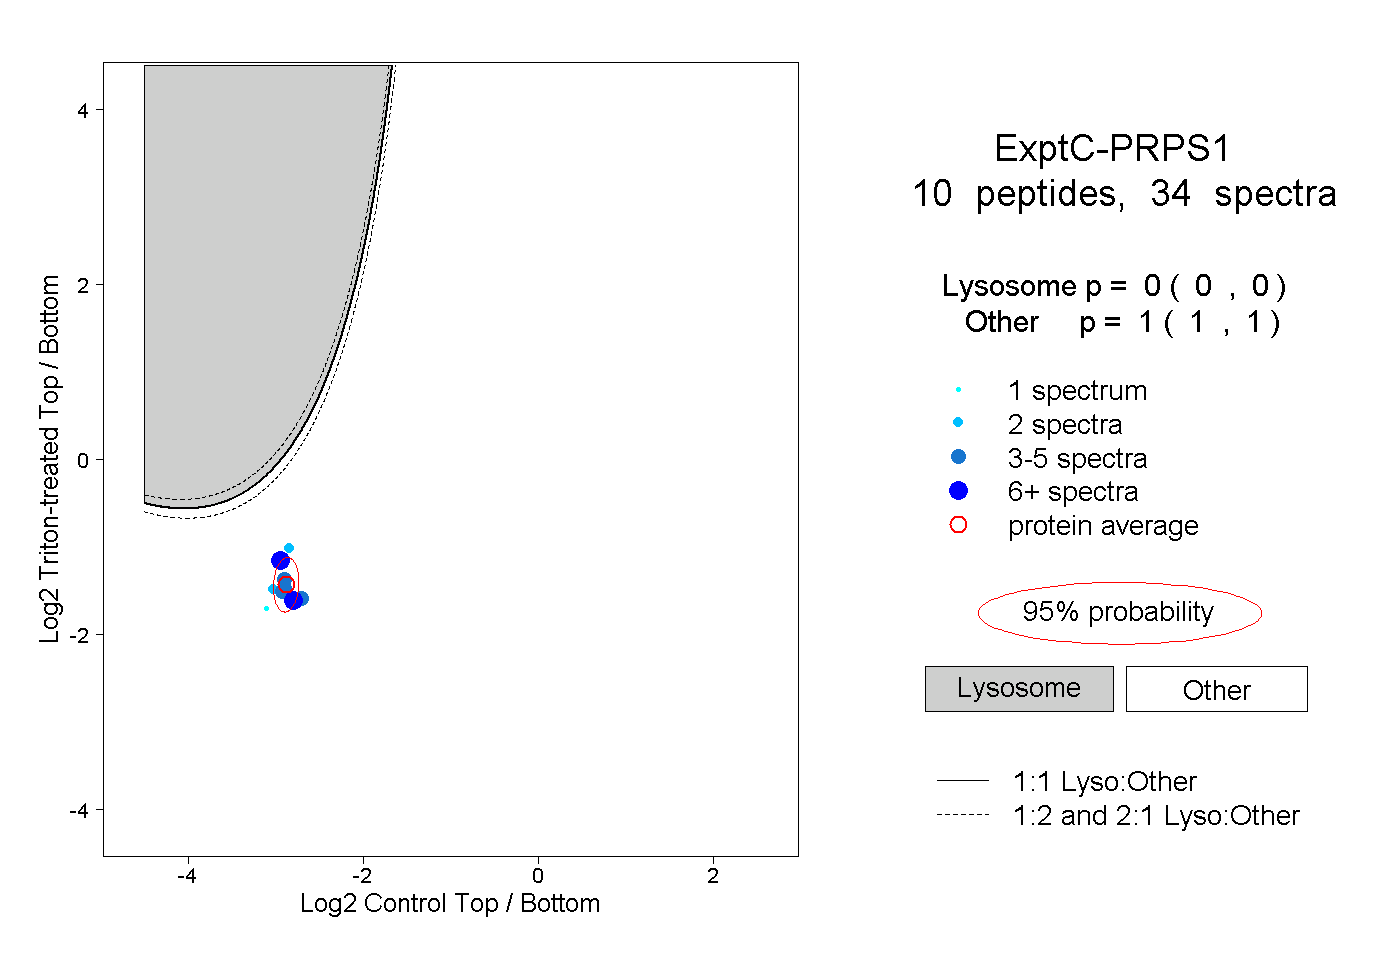
0.000 | 0.000
1.000 | 1.000
2peptides
spectra
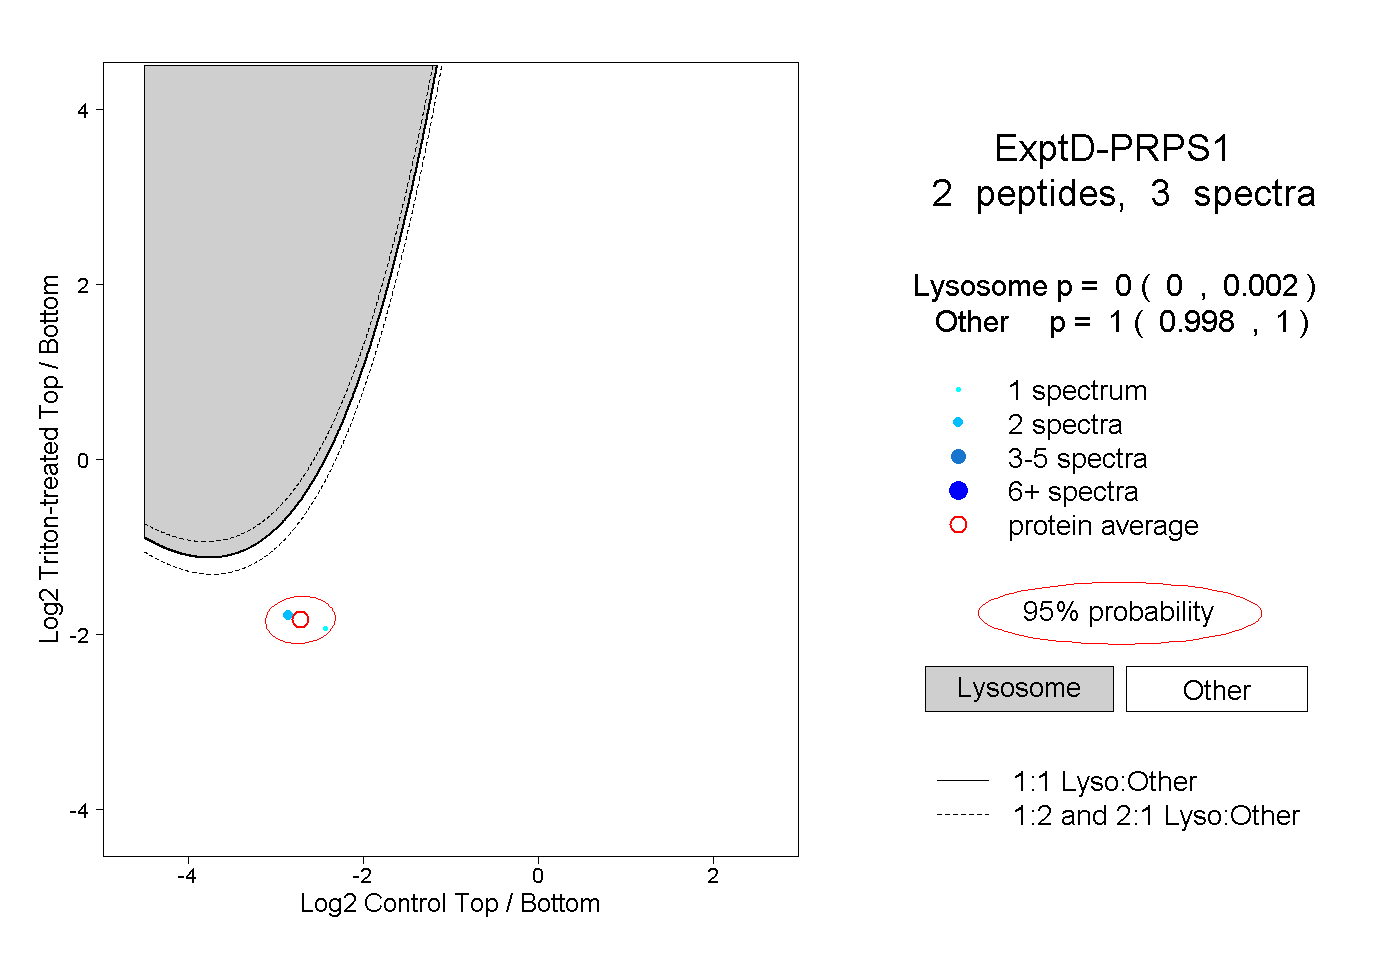
0.000 | 0.002
0.998 | 1.000