 11
11peptides
spectra
0.000 | 0.000
0.000 | 0.000
0.000 | 0.000
0.000 | 0.000
0.083 | 0.120
0.000 | 0.027
0.876 | 0.891
0.000 | 0.000
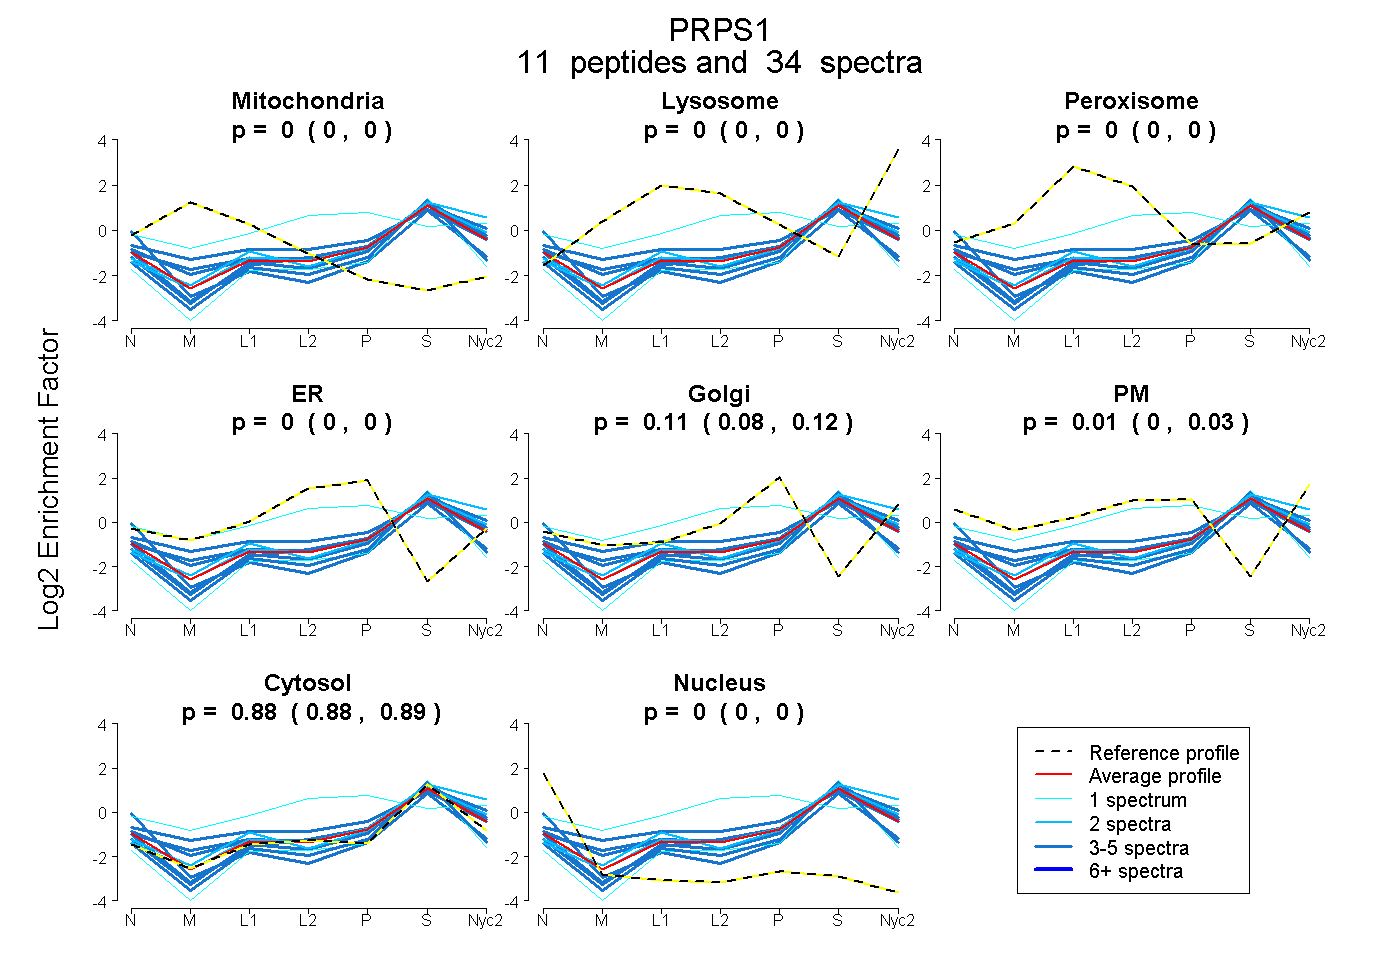
| Plot | Mito | Lyso | Perox | ER | Golgi | PM | Cytosol | Nucleus | |||||
| Expt A |
11 peptides |
34 spectra |
|
0.000 0.000 | 0.000 |
0.000 0.000 | 0.000 |
0.000 0.000 | 0.000 |
0.000 0.000 | 0.000 |
0.109 0.083 | 0.120 |
0.007 0.000 | 0.027 |
0.884 0.876 | 0.891 |
0.000 0.000 | 0.000 |
| 3 spectra, LGIEIGK | 0.009 | 0.039 | 0.000 | 0.000 | 0.065 | 0.053 | 0.834 | 0.000 | ||
| 2 spectra, VTSIADR | 0.000 | 0.128 | 0.000 | 0.000 | 0.017 | 0.000 | 0.855 | 0.000 | ||
| 4 spectra, LLSAGATR | 0.000 | 0.045 | 0.000 | 0.000 | 0.016 | 0.110 | 0.828 | 0.000 | ||
| 5 spectra, ENISEWK | 0.000 | 0.000 | 0.000 | 0.000 | 0.000 | 0.000 | 0.778 | 0.222 | ||
| 1 spectrum, FSNQETCVEIGESVR | 0.000 | 0.000 | 0.228 | 0.131 | 0.132 | 0.167 | 0.342 | 0.000 | ||
| 4 spectra, VTAVIPCFPYAR | 0.000 | 0.000 | 0.000 | 0.000 | 0.000 | 0.000 | 0.935 | 0.065 | ||
| 5 spectra, ANEVDR | 0.000 | 0.000 | 0.000 | 0.000 | 0.087 | 0.000 | 0.913 | 0.000 | ||
| 3 spectra, IFSGSSHQDLSQK | 0.017 | 0.000 | 0.113 | 0.000 | 0.102 | 0.065 | 0.702 | 0.000 | ||
| 1 spectrum, VAILVDDMADTCGTICHAADK | 0.000 | 0.000 | 0.000 | 0.000 | 0.000 | 0.000 | 0.947 | 0.053 | ||
| 4 spectra, LNVDFALIHK | 0.000 | 0.000 | 0.000 | 0.000 | 0.032 | 0.000 | 0.968 | 0.000 | ||
| 2 spectra, MVLVGDVK | 0.000 | 0.070 | 0.000 | 0.000 | 0.054 | 0.000 | 0.876 | 0.000 |
| Plot | Mito | Lyso or Perox | ER | Golgi | PM | Cytosol | Nucleus | ||||||
| Expt B |
3 peptides |
4 spectra |
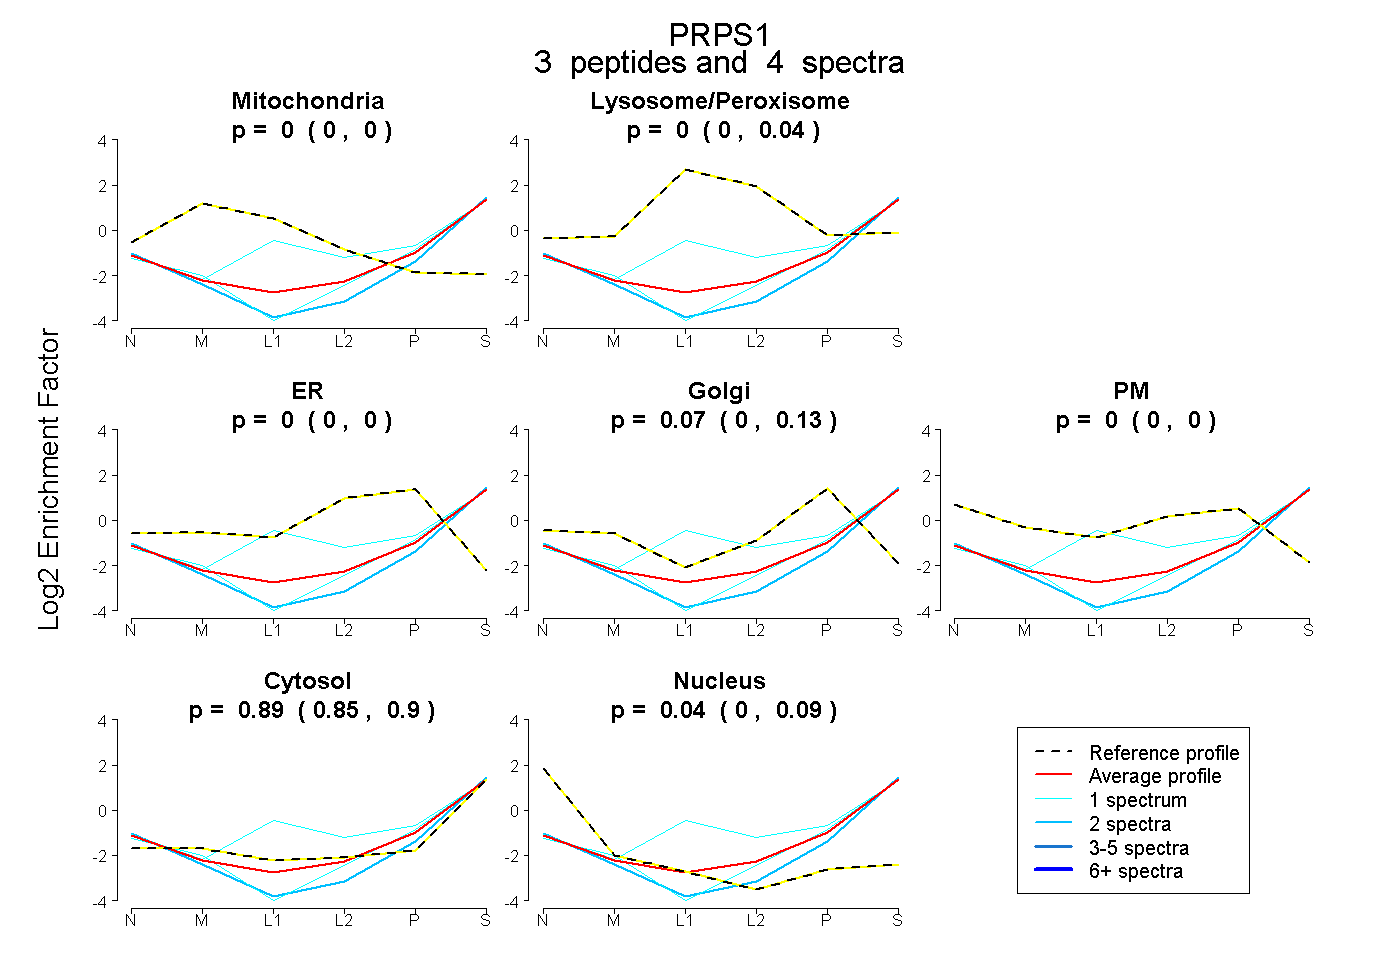 |
0.000 0.000 | 0.000 |
0.000 0.000 | 0.037 |
0.000 0.000 | 0.000 |
0.075 0.003 | 0.126 |
0.000 0.000 | 0.000 |
0.885 0.854 | 0.902 |
0.040 0.000 | 0.090 |
|||
| Plot | Lyso | Other | |||||||||||
| Expt C |
10 peptides |
34 spectra |
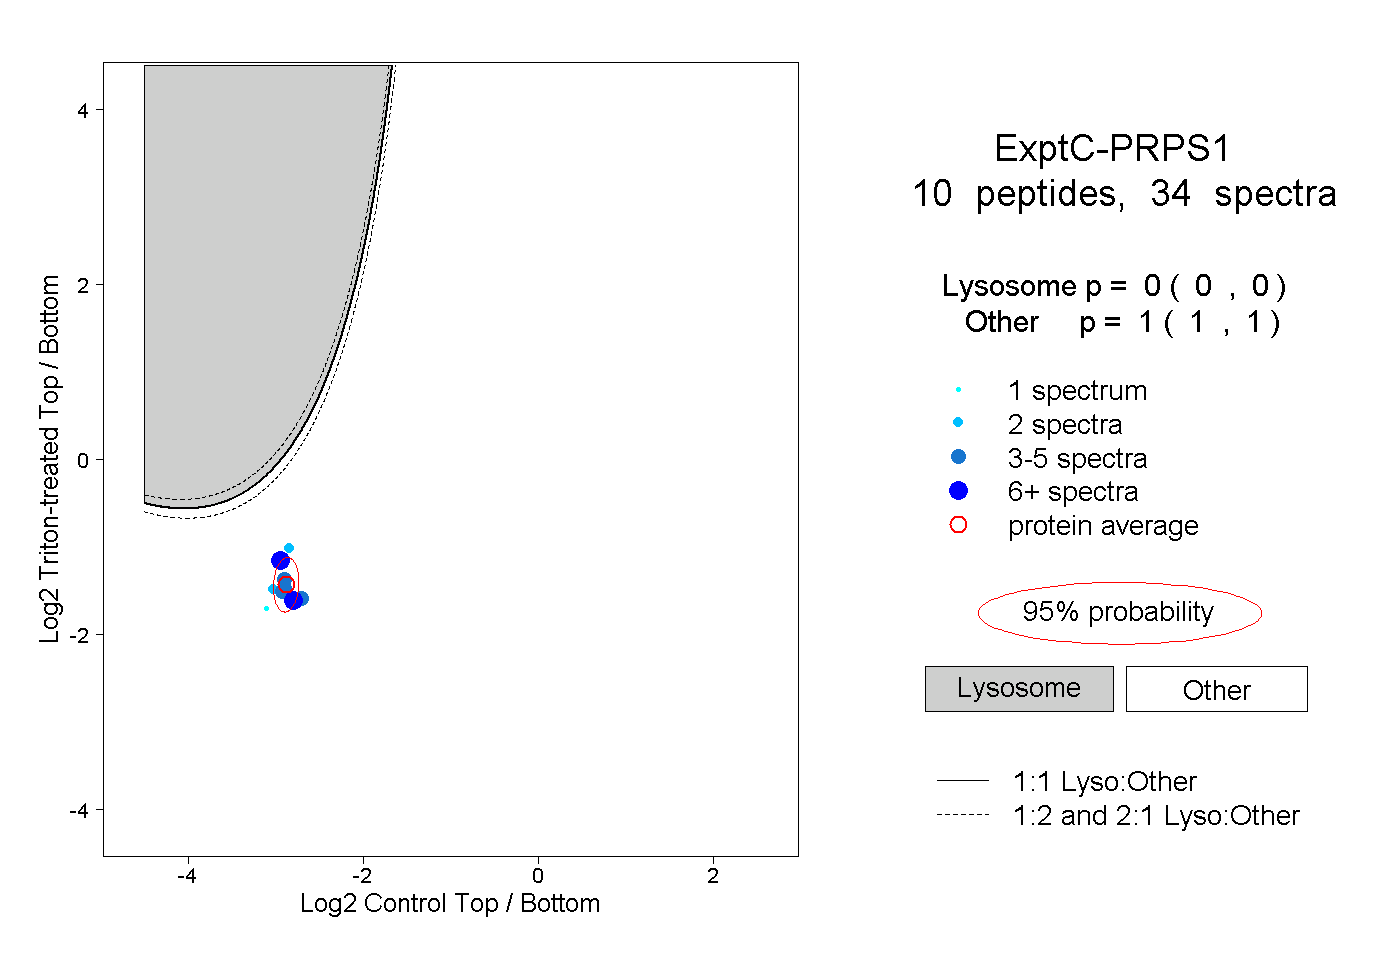 |
0.000 0.000 | 0.000 |
1.000 1.000 | 1.000 |
||||||||
| Plot | Lyso | Other | |||||||||||
| Expt D |
2 peptides |
3 spectra |
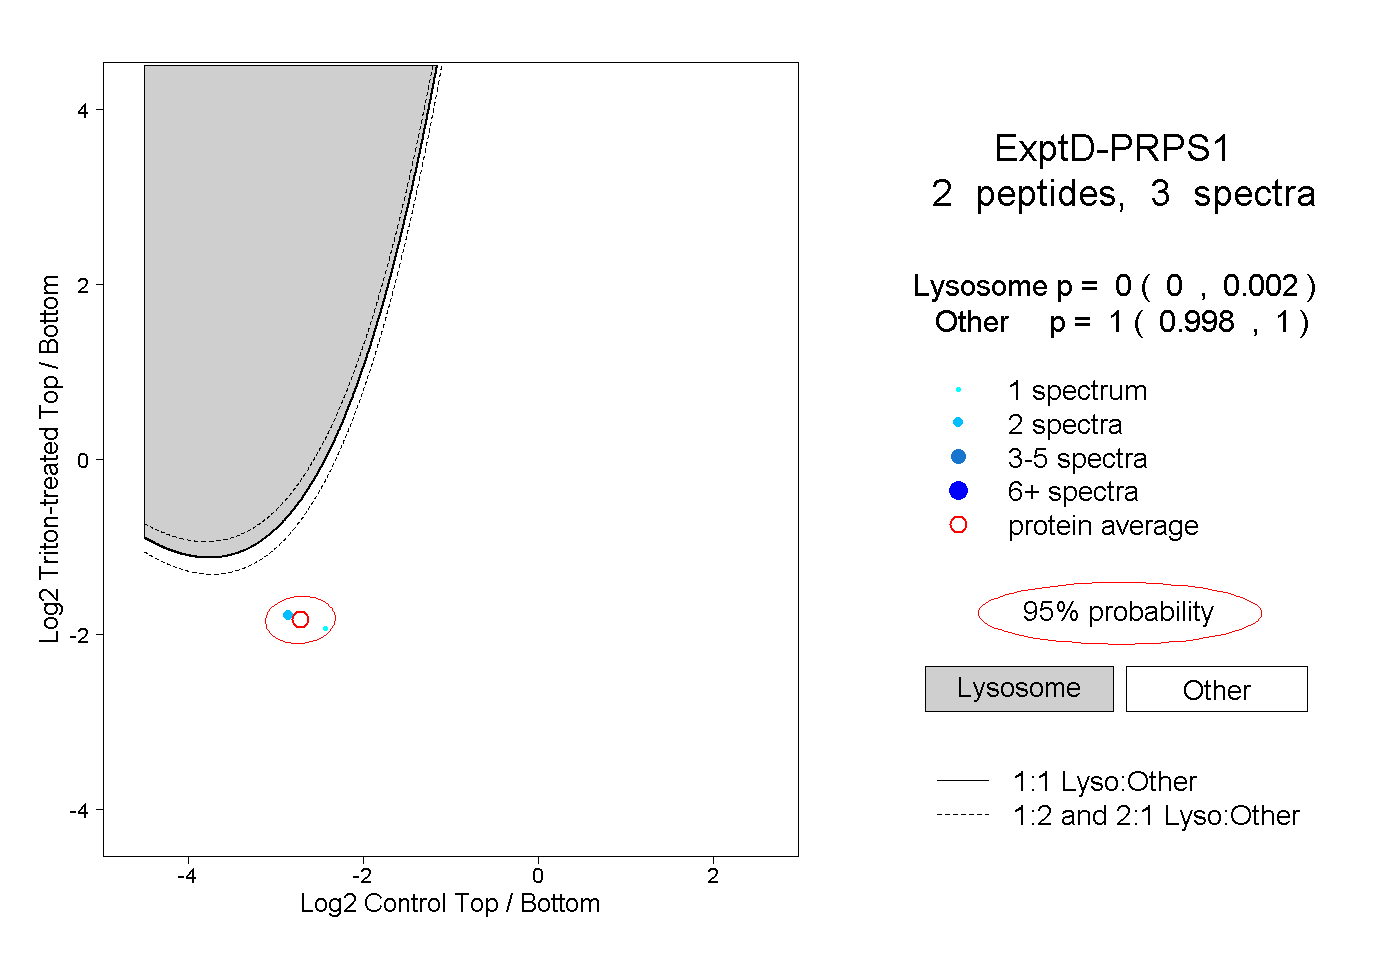 |
0.000 0.000 | 0.002 |
1.000 0.998 | 1.000 |