 5
5peptides
spectra
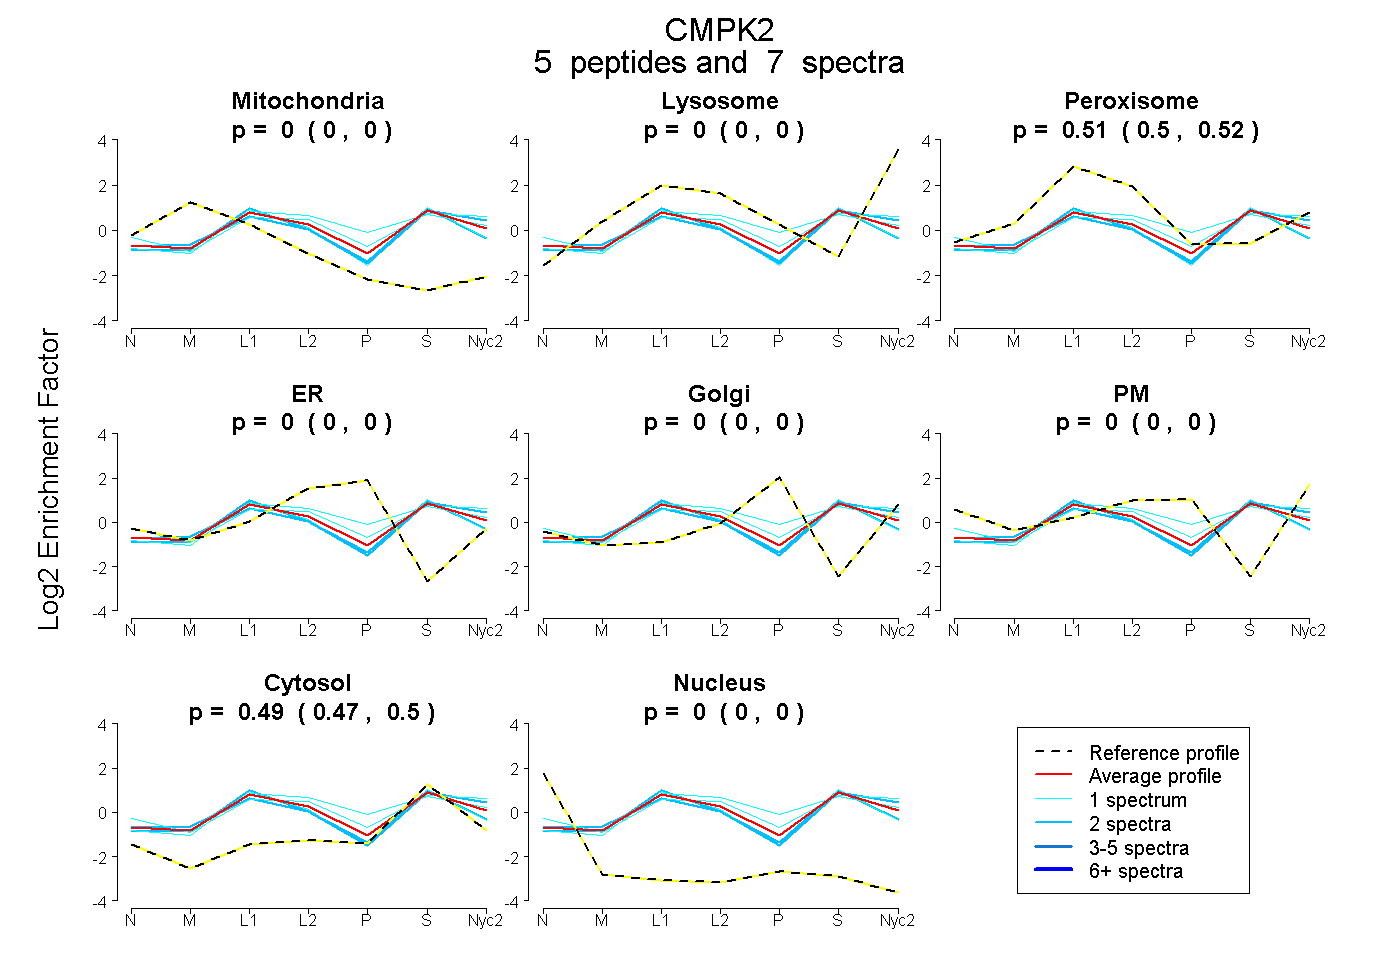
0.000 | 0.000
0.000 | 0.000
0.501 | 0.523
0.000 | 0.000
0.000 | 0.000
0.000 | 0.000
0.475 | 0.497
0.000 | 0.000
12peptides
spectra
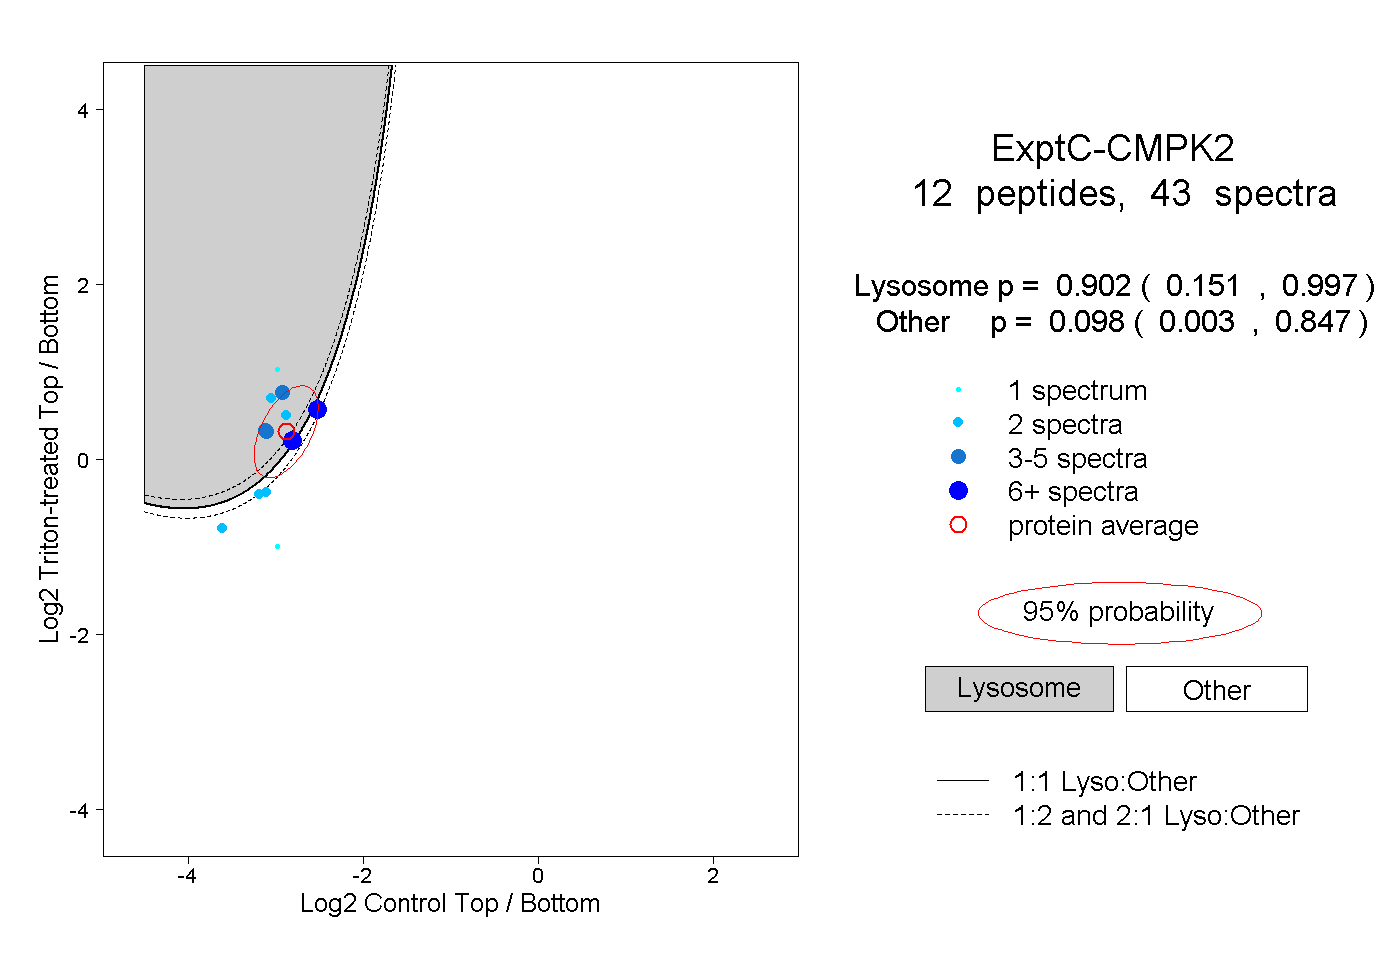
0.151 | 0.997
0.003 | 0.847
2peptides
spectra
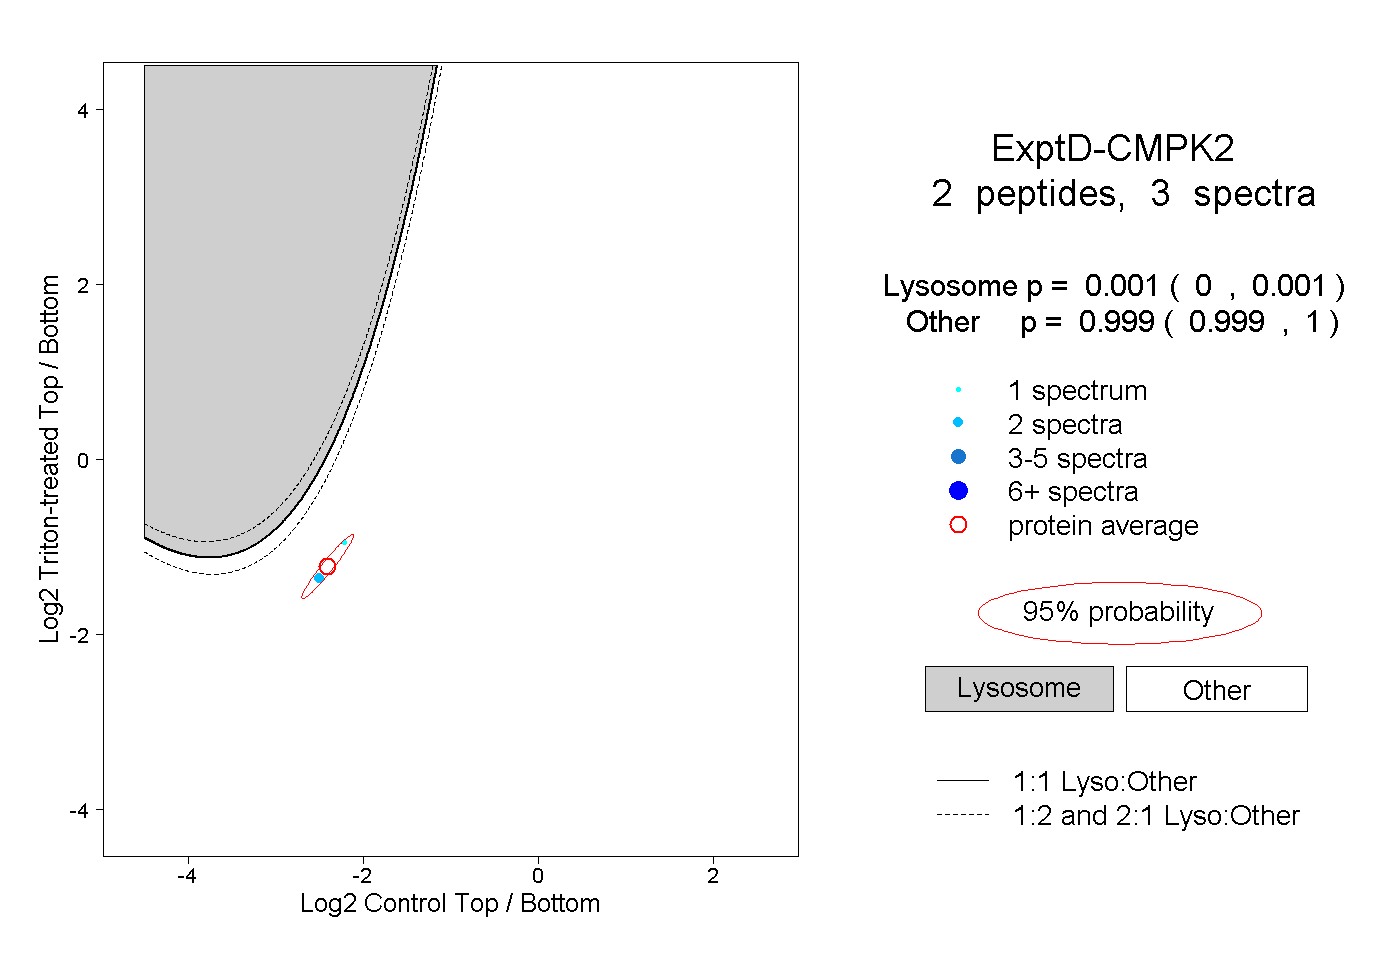
0.000 | 0.001
0.999 | 1.000