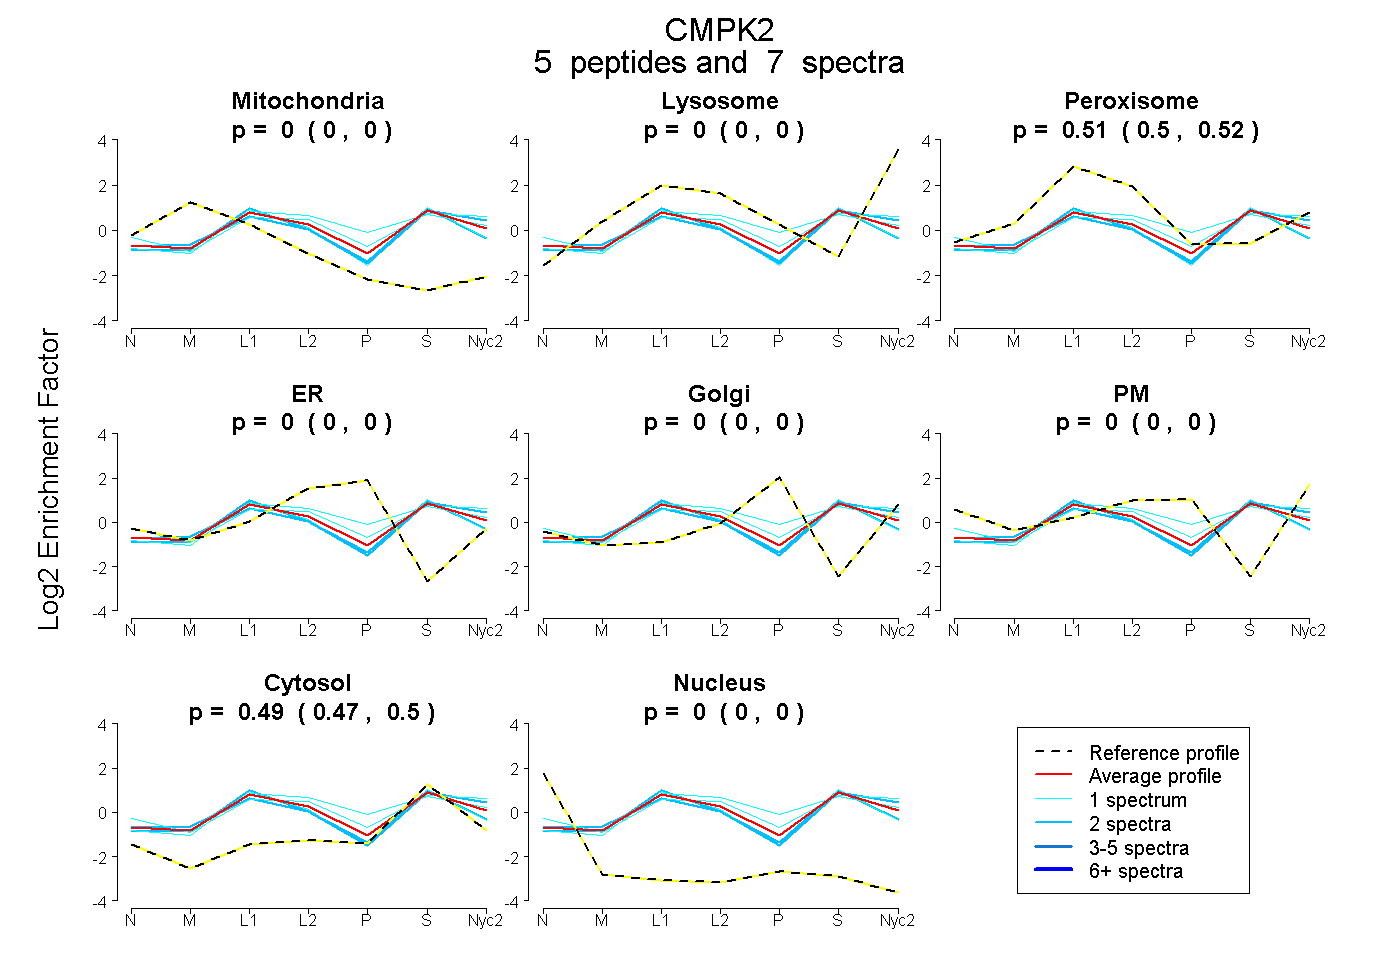
 5
5peptides
spectra
0.000 | 0.000
0.000 | 0.000
0.501 | 0.523
0.000 | 0.000
0.000 | 0.000
0.000 | 0.000
0.475 | 0.497
0.000 | 0.000
| Plot | Mito | Lyso | Perox | ER | Golgi | PM | Cytosol | Nucleus | |||||
| Expt A |
5 peptides |
7 spectra |
|
0.000 0.000 | 0.000 |
0.000 0.000 | 0.000 |
0.513 0.501 | 0.523 |
0.000 0.000 | 0.000 |
0.000 0.000 | 0.000 |
0.000 0.000 | 0.000 |
0.487 0.475 | 0.497 |
0.000 0.000 | 0.000 |
| 1 spectrum, LTELLGPPGR | 0.000 | 0.062 | 0.425 | 0.000 | 0.000 | 0.067 | 0.447 | 0.000 | ||
| 2 spectra, LFDDEPTIIR | 0.000 | 0.040 | 0.453 | 0.000 | 0.000 | 0.000 | 0.507 | 0.000 | ||
| 1 spectrum, EVLDLVDQCPR | 0.000 | 0.000 | 0.466 | 0.000 | 0.000 | 0.000 | 0.534 | 0.000 | ||
| 2 spectra, AVLEECTSFIPEAR | 0.010 | 0.000 | 0.478 | 0.000 | 0.000 | 0.000 | 0.512 | 0.000 | ||
| 1 spectrum, DPSDHPDTR | 0.000 | 0.017 | 0.523 | 0.000 | 0.068 | 0.000 | 0.392 | 0.000 |
| Plot | Lyso | Other | |||||||||||
| Expt C |
12 peptides |
43 spectra |
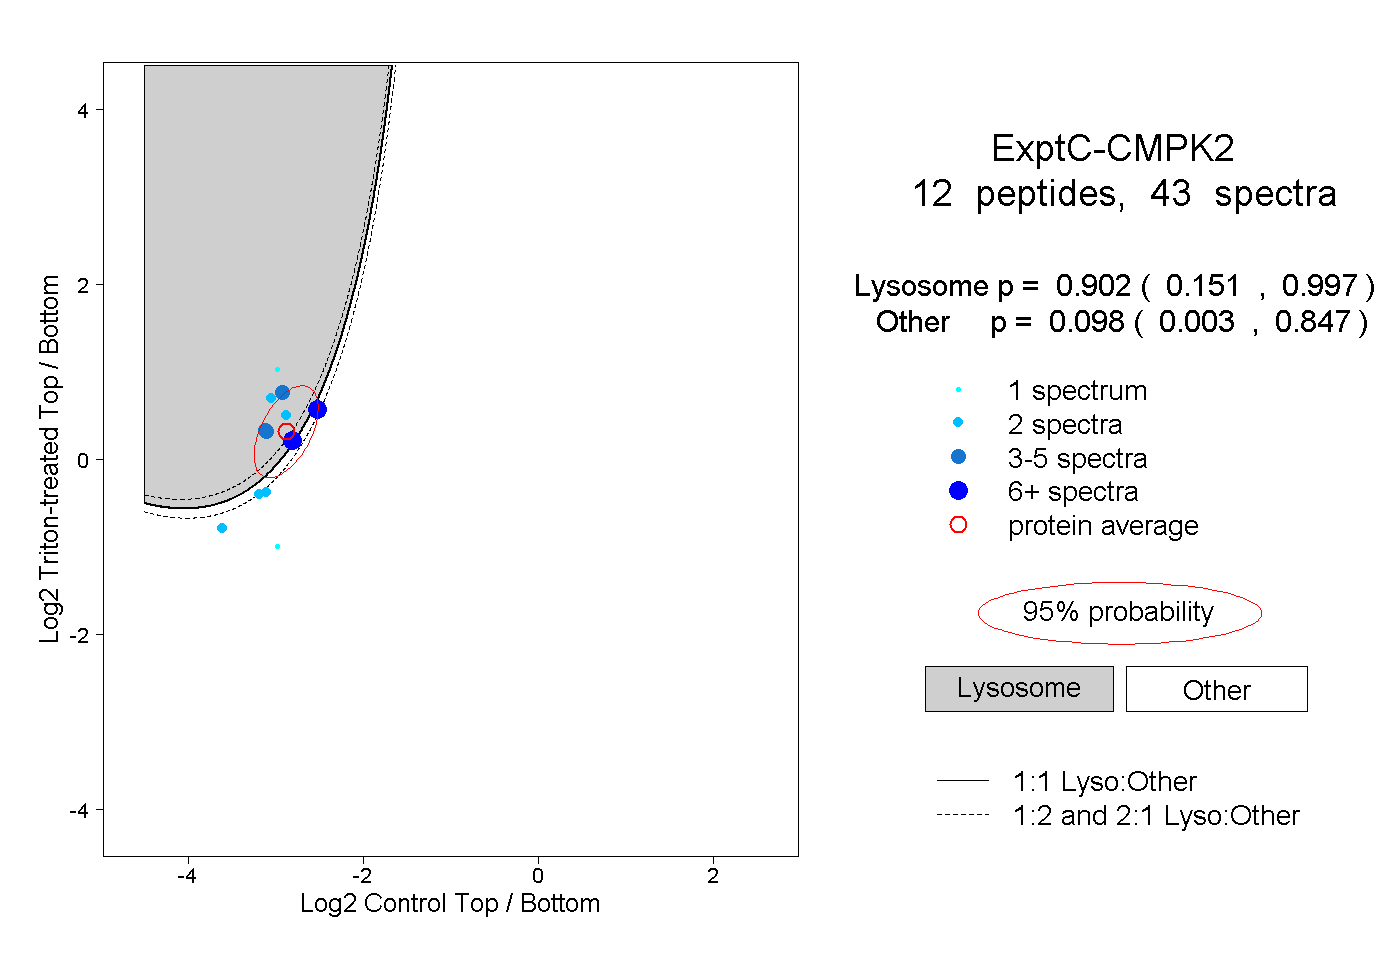 |
0.902 0.151 | 0.997 |
0.098 0.003 | 0.847 |
||||||||
| Plot | Lyso | Other | |||||||||||
| Expt D |
2 peptides |
3 spectra |
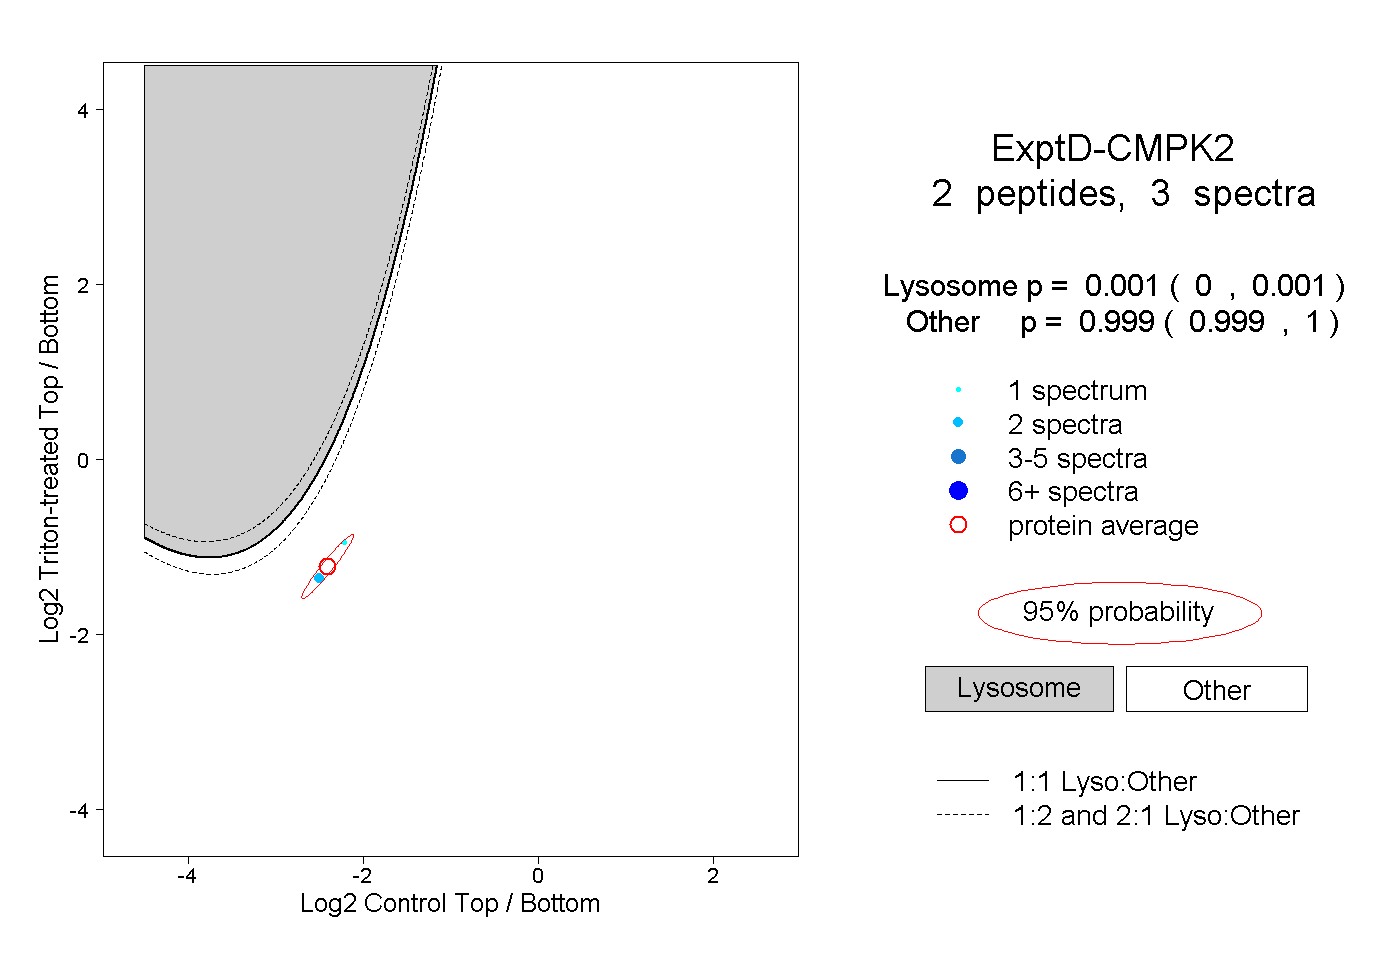 |
0.001 0.000 | 0.001 |
0.999 0.999 | 1.000 |