 10
10peptides
spectra
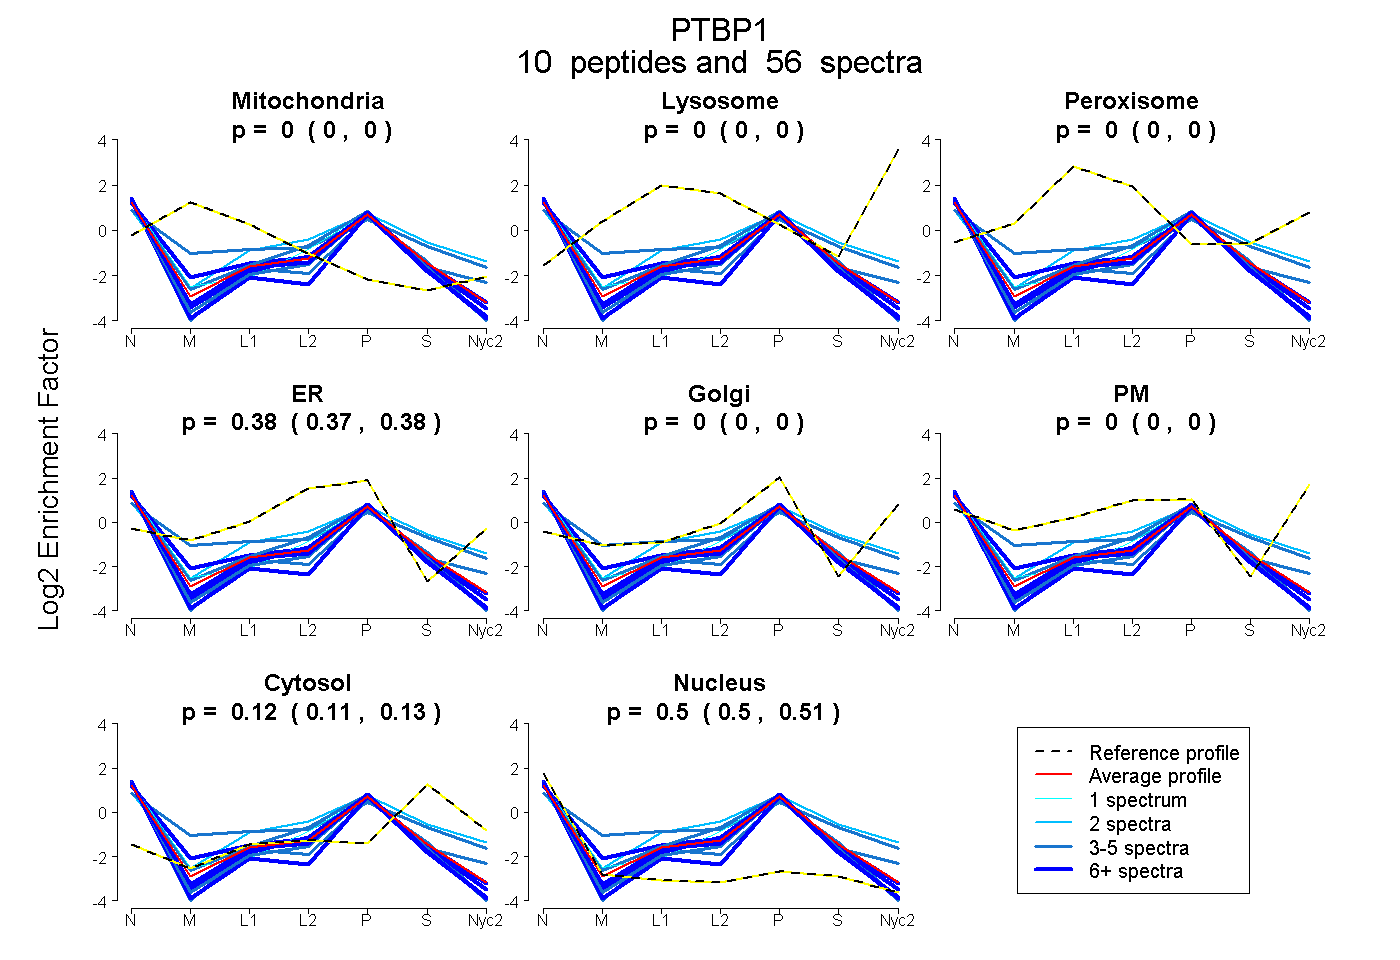
0.000 | 0.000
0.000 | 0.000
0.000 | 0.000
0.369 | 0.381
0.000 | 0.000
0.000 | 0.000
0.113 | 0.127
0.497 | 0.510
5peptides
spectra
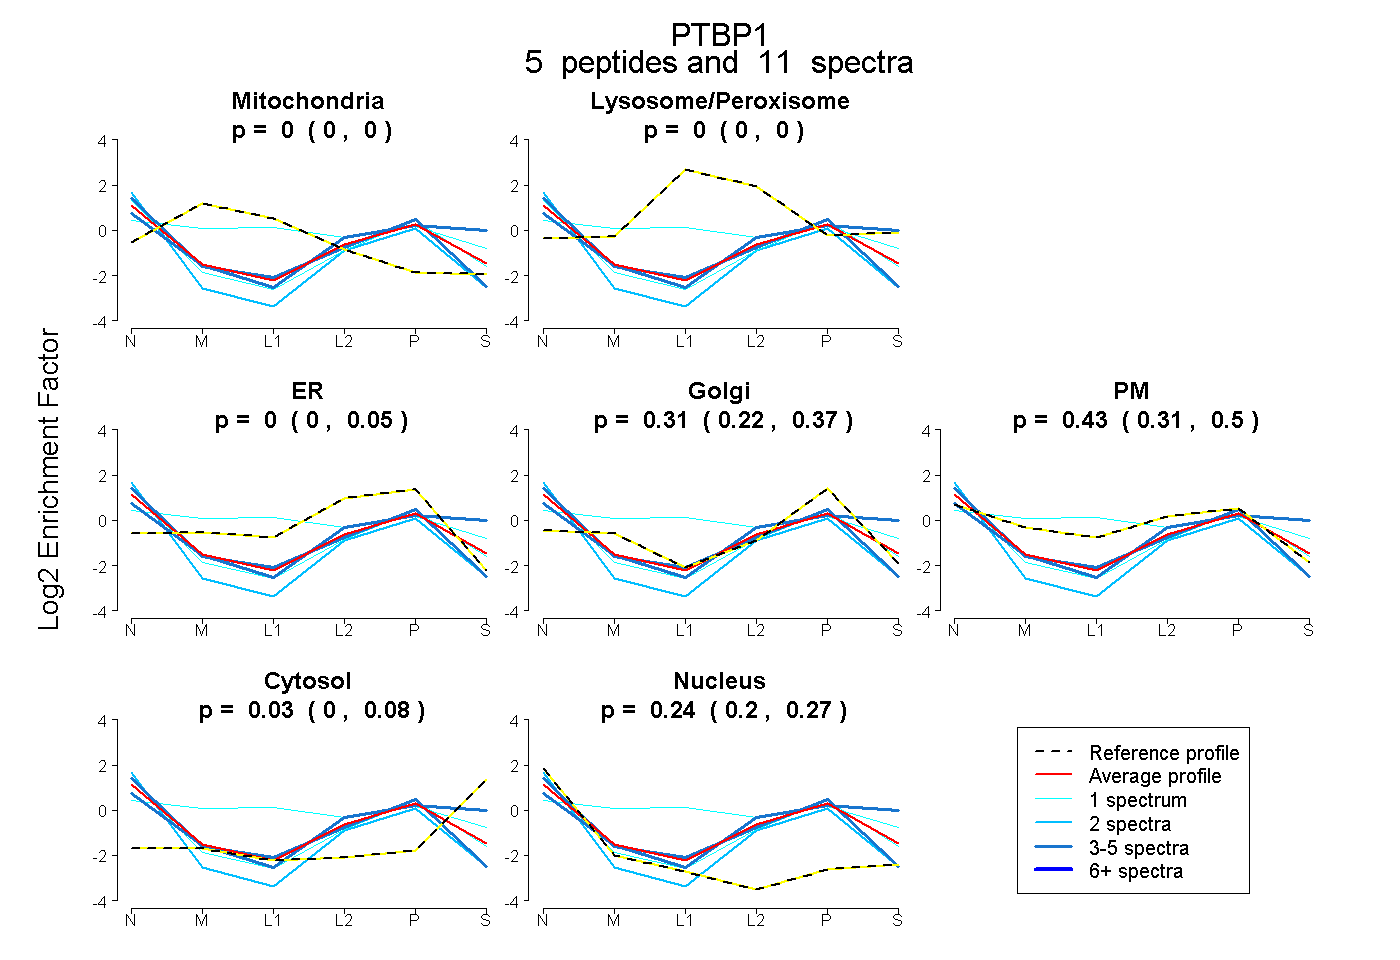
0.000 | 0.000
0.000 | 0.000
0.000 | 0.049
0.218 | 0.373
0.309 | 0.501
0.000 | 0.076
0.200 | 0.270
10peptides
spectra
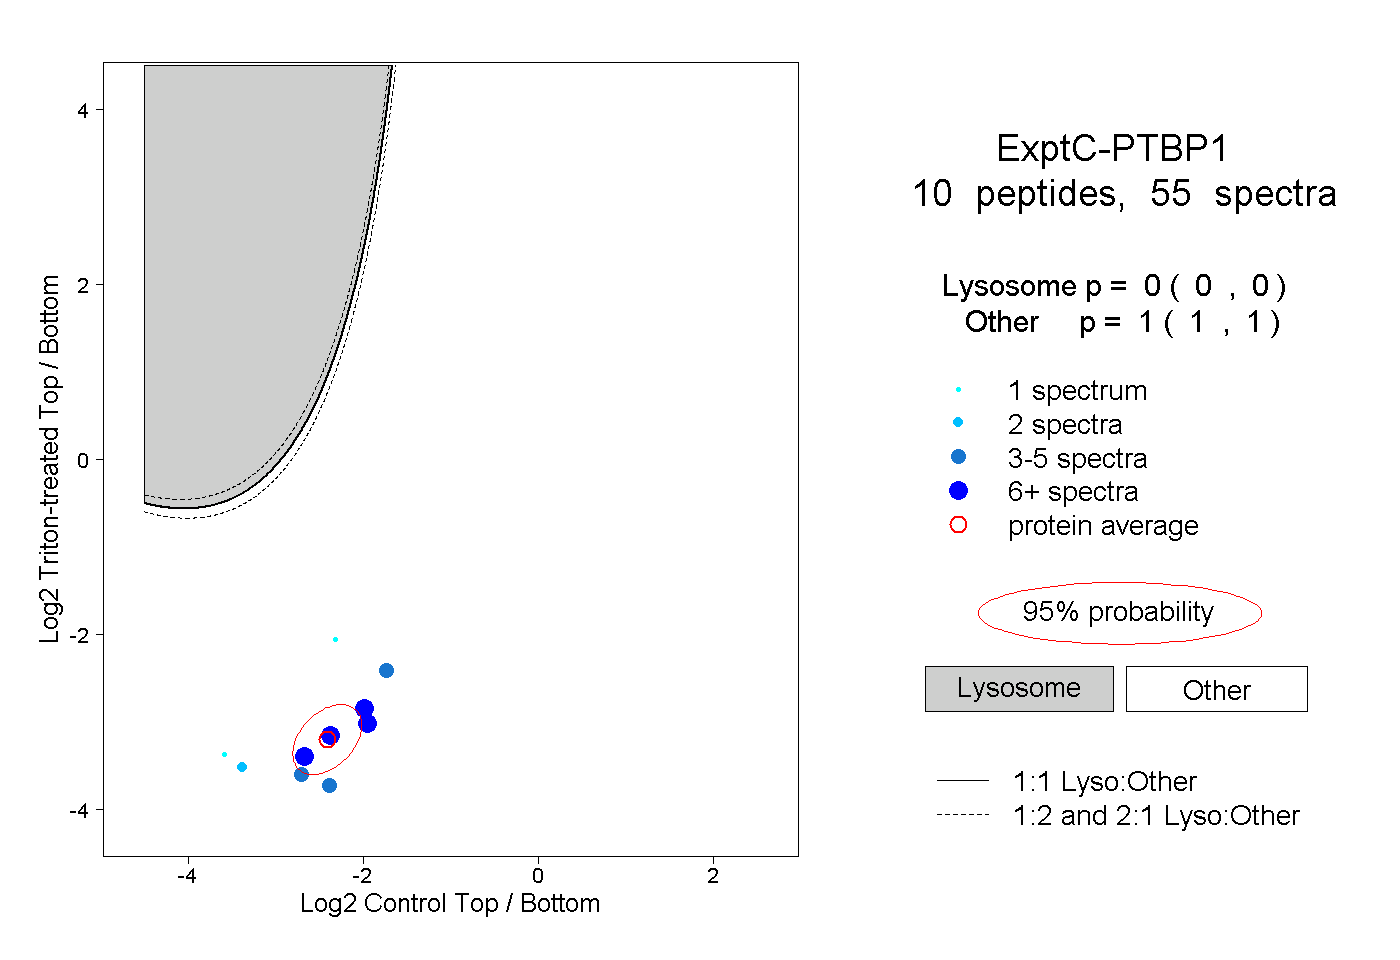
0.000 | 0.000
1.000 | 1.000
4peptides
spectra
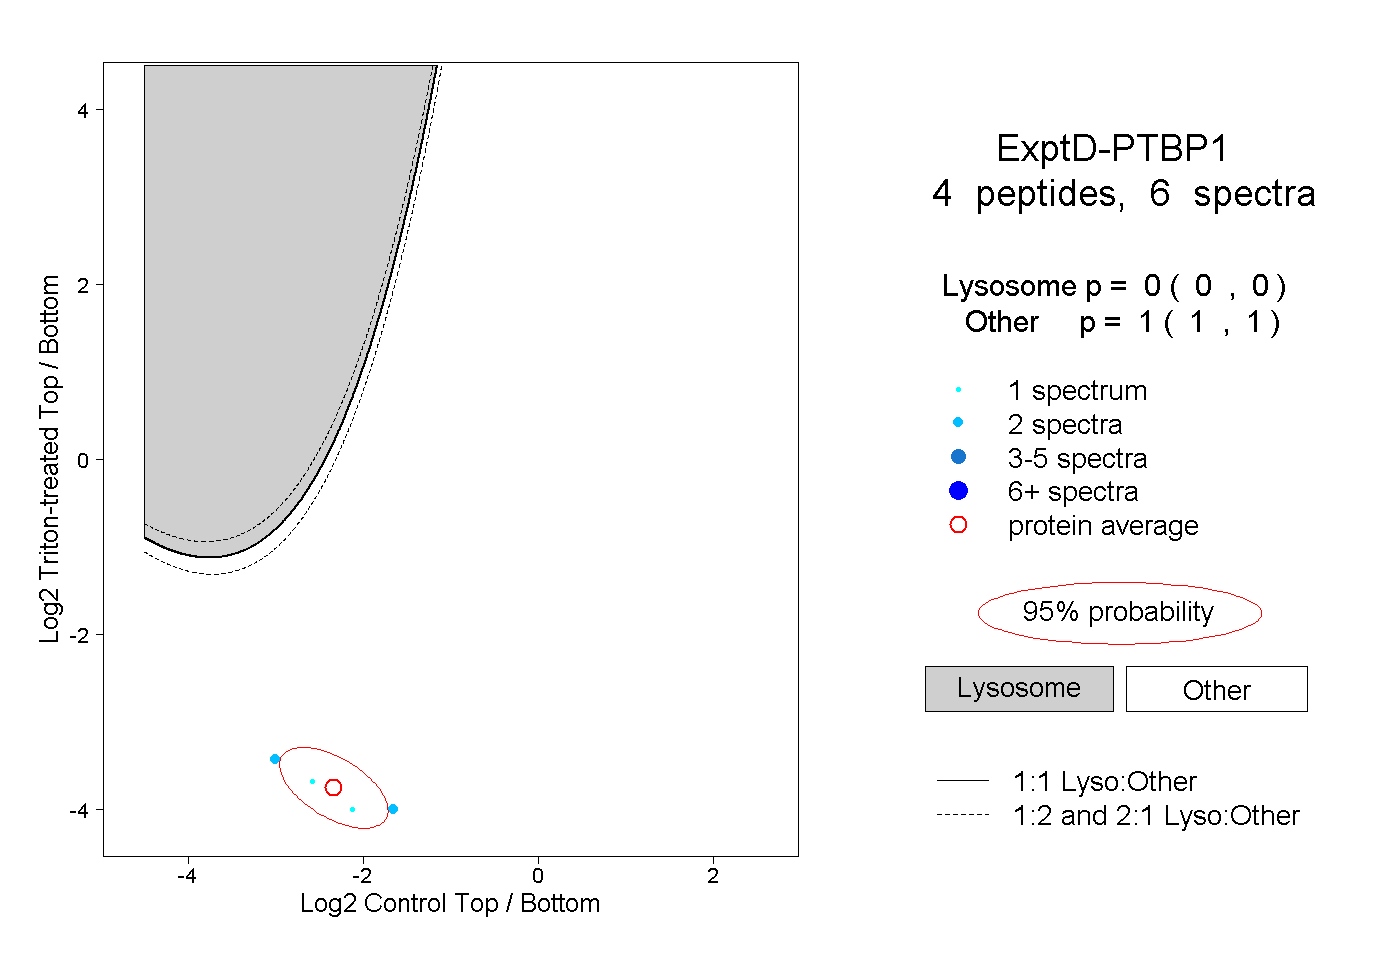
0.000 | 0.000
1.000 | 1.000