 10
10peptides
spectra
0.000 | 0.000
0.000 | 0.000
0.000 | 0.000
0.369 | 0.381
0.000 | 0.000
0.000 | 0.000
0.113 | 0.127
0.497 | 0.510
| Plot | Mito | Lyso | Perox | ER | Golgi | PM | Cytosol | Nucleus | |||||
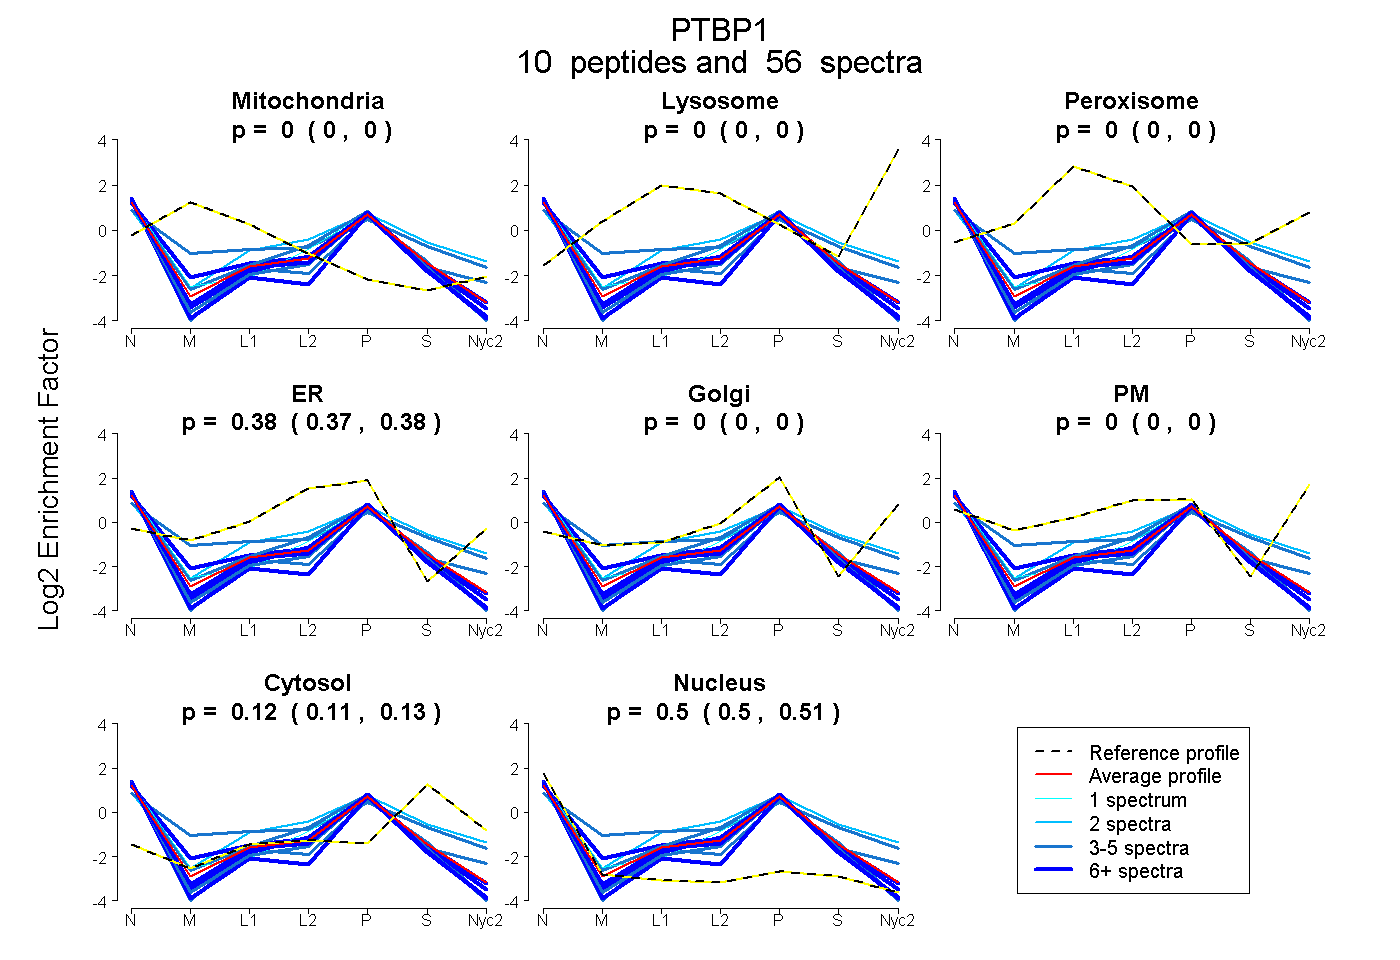
| Expt A |
10 peptides |
56 spectra |
|
0.000 0.000 | 0.000 |
0.000 0.000 | 0.000 |
0.000 0.000 | 0.000 |
0.376 0.369 | 0.381 |
0.000 0.000 | 0.000 |
0.000 0.000 | 0.000 |
0.120 0.113 | 0.127 |
0.504 0.497 | 0.510 |
| 4 spectra, LTSLNVK | 0.000 | 0.000 | 0.000 | 0.482 | 0.000 | 0.000 | 0.097 | 0.421 | ||
| 2 spectra, EGQEDQGLTK | 0.000 | 0.000 | 0.000 | 0.450 | 0.000 | 0.000 | 0.352 | 0.198 | ||
| 6 spectra, VTNILMLK | 0.000 | 0.000 | 0.000 | 0.368 | 0.000 | 0.000 | 0.037 | 0.595 | ||
| 7 spectra, TDSSPNQAR | 0.000 | 0.000 | 0.000 | 0.213 | 0.041 | 0.000 | 0.062 | 0.684 | ||
| 3 spectra, LSLDGQNIYNACCTLR | 0.000 | 0.000 | 0.000 | 0.239 | 0.000 | 0.000 | 0.139 | 0.621 | ||
| 10 spectra, IITFTK | 0.000 | 0.000 | 0.000 | 0.420 | 0.000 | 0.000 | 0.085 | 0.494 | ||
| 5 spectra, HQSVQLPR | 0.009 | 0.000 | 0.076 | 0.367 | 0.045 | 0.000 | 0.246 | 0.256 | ||
| 14 spectra, STGVPSR | 0.000 | 0.000 | 0.000 | 0.363 | 0.000 | 0.000 | 0.087 | 0.550 | ||
| 1 spectrum, SLFSSNGGVVK | 0.000 | 0.000 | 0.000 | 0.418 | 0.000 | 0.000 | 0.000 | 0.582 | ||
| 4 spectra, VIHVR | 0.000 | 0.000 | 0.000 | 0.314 | 0.000 | 0.000 | 0.066 | 0.620 |
| Plot | Mito | Lyso or Perox | ER | Golgi | PM | Cytosol | Nucleus | ||||||
| Expt B |
5 peptides |
11 spectra |
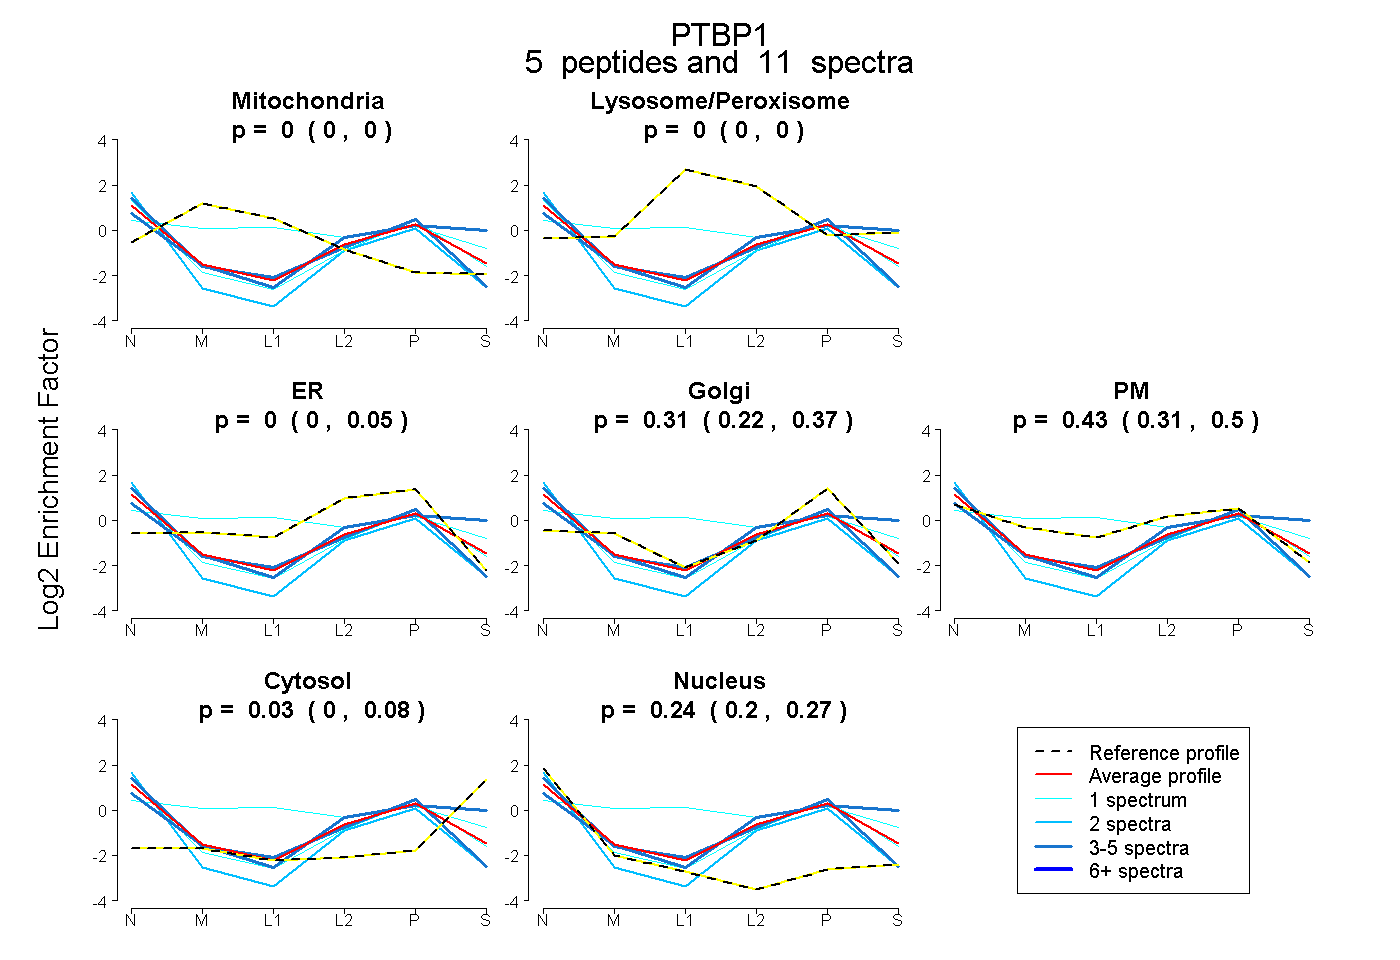 |
0.000 0.000 | 0.000 |
0.000 0.000 | 0.000 |
0.000 0.000 | 0.049 |
0.306 0.218 | 0.373 |
0.426 0.309 | 0.501 |
0.032 0.000 | 0.076 |
0.236 0.200 | 0.270 |
|||
| Plot | Lyso | Other | |||||||||||
| Expt C |
10 peptides |
55 spectra |
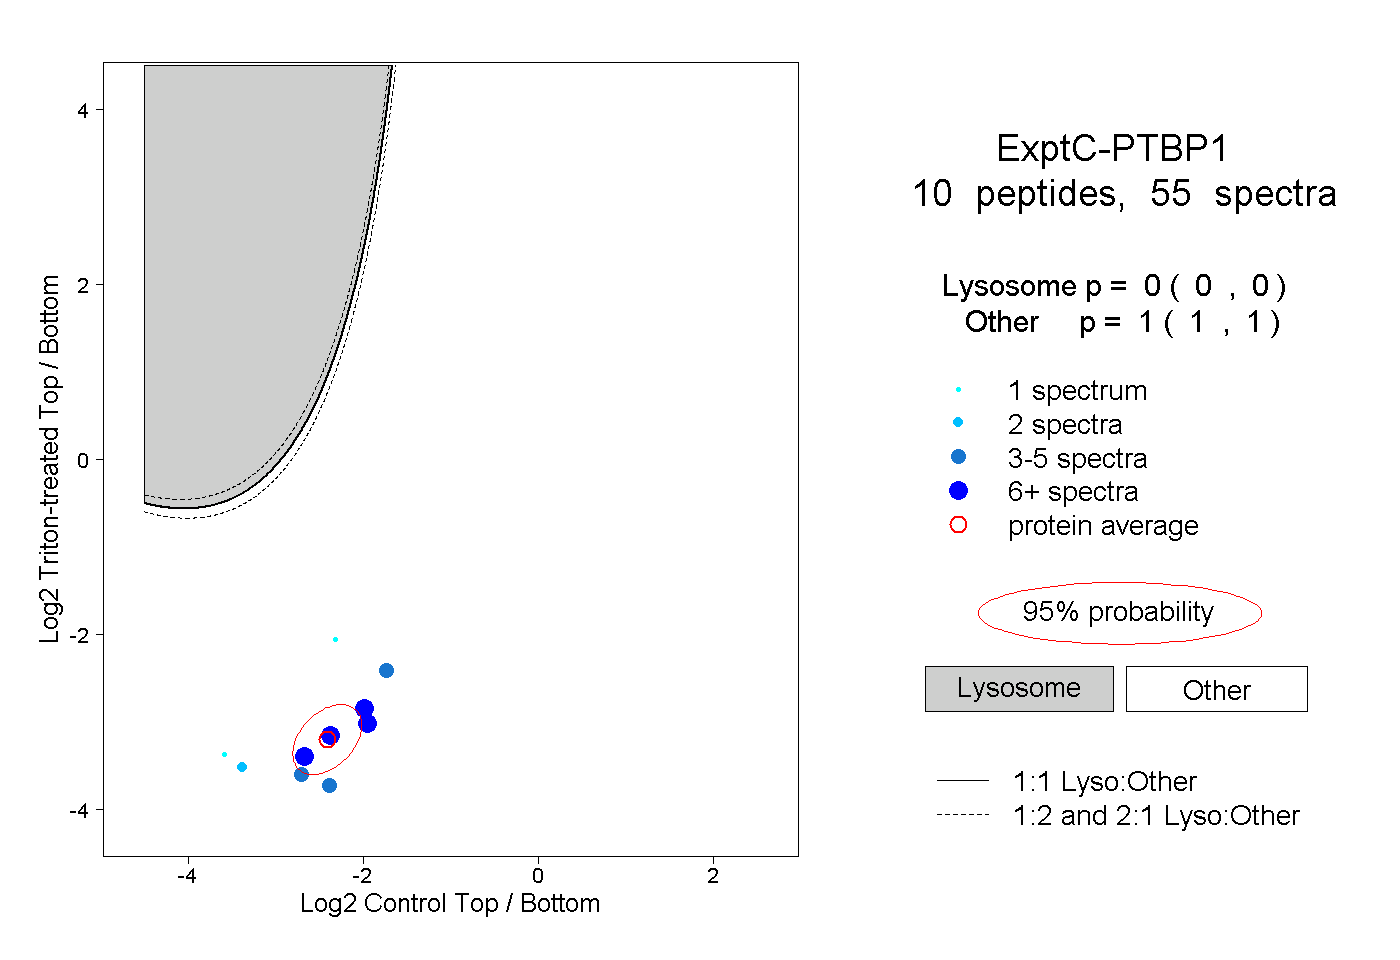 |
0.000 0.000 | 0.000 |
1.000 1.000 | 1.000 |
||||||||
| Plot | Lyso | Other | |||||||||||
| Expt D |
4 peptides |
6 spectra |
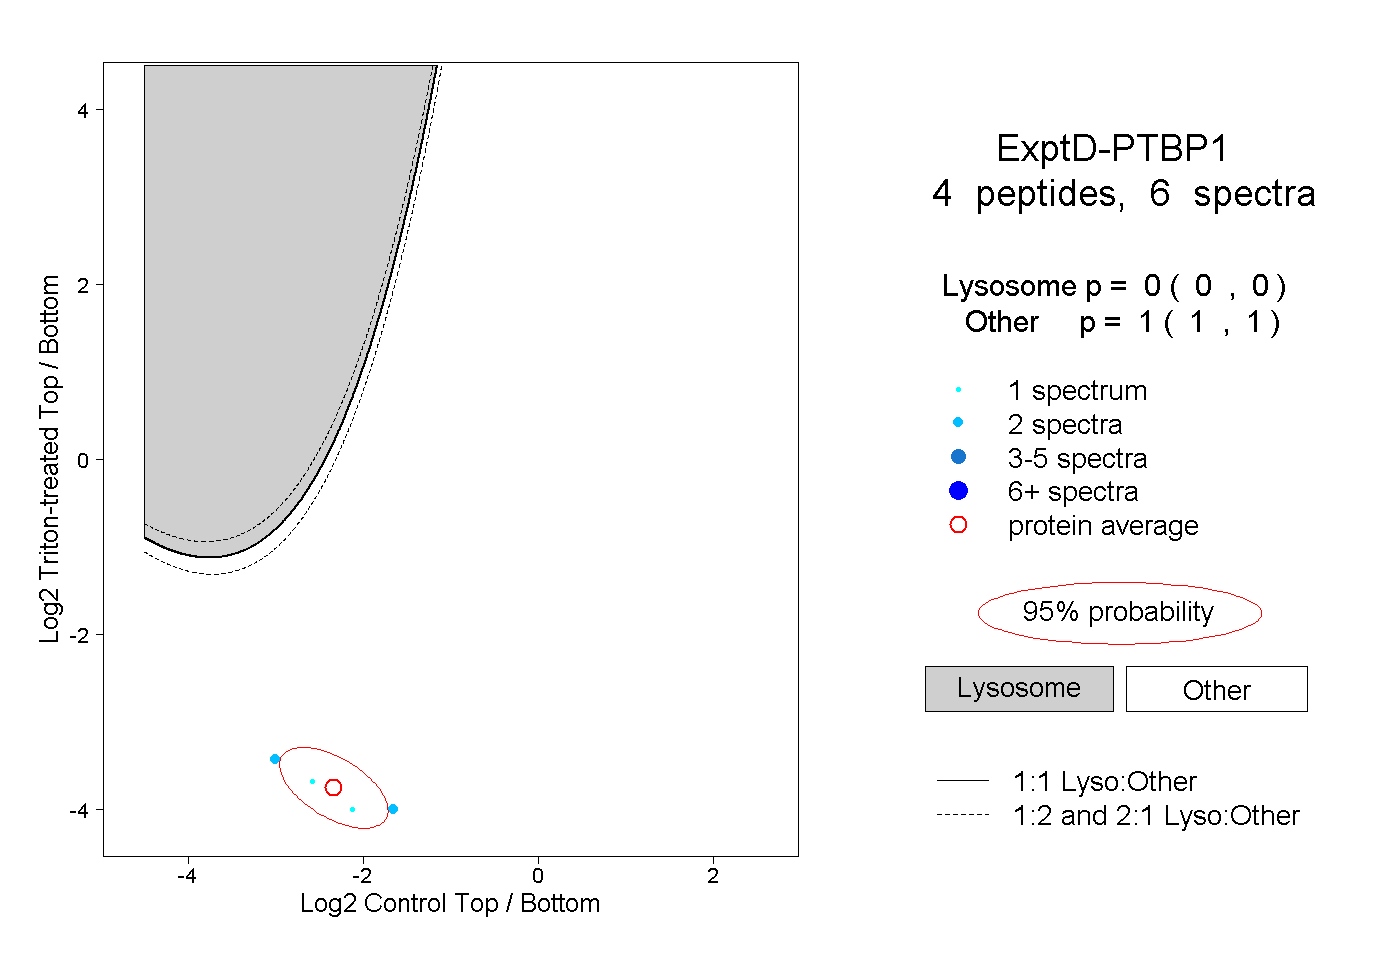 |
0.000 0.000 | 0.000 |
1.000 1.000 | 1.000 |