 7
7peptides
spectra
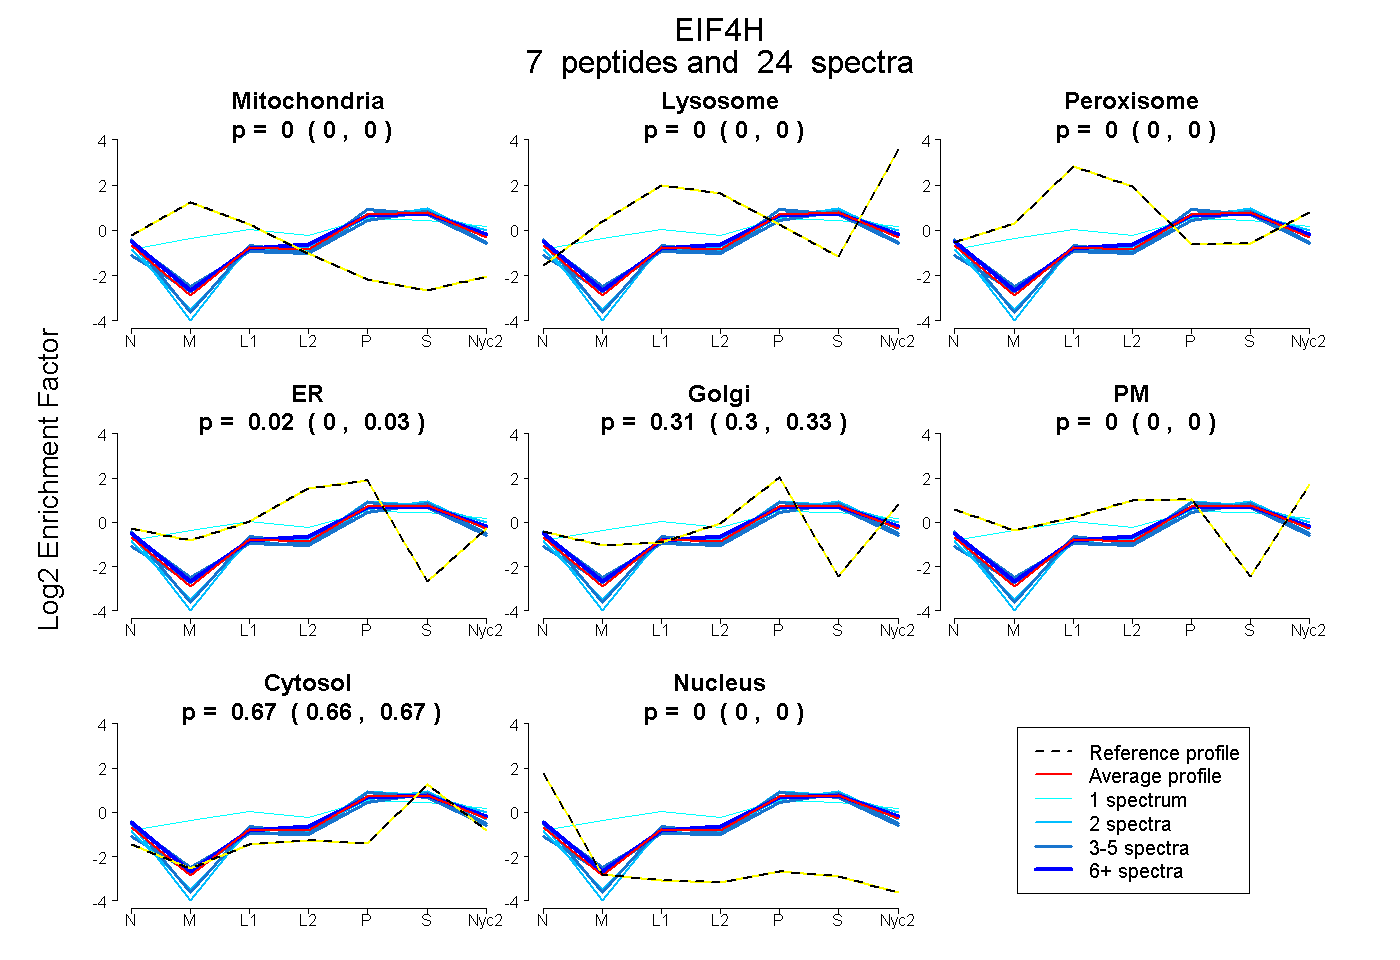
0.000 | 0.000
0.000 | 0.000
0.000 | 0.000
0.001 | 0.033
0.296 | 0.329
0.000 | 0.000
0.660 | 0.674
0.000 | 0.000
3peptides
spectra
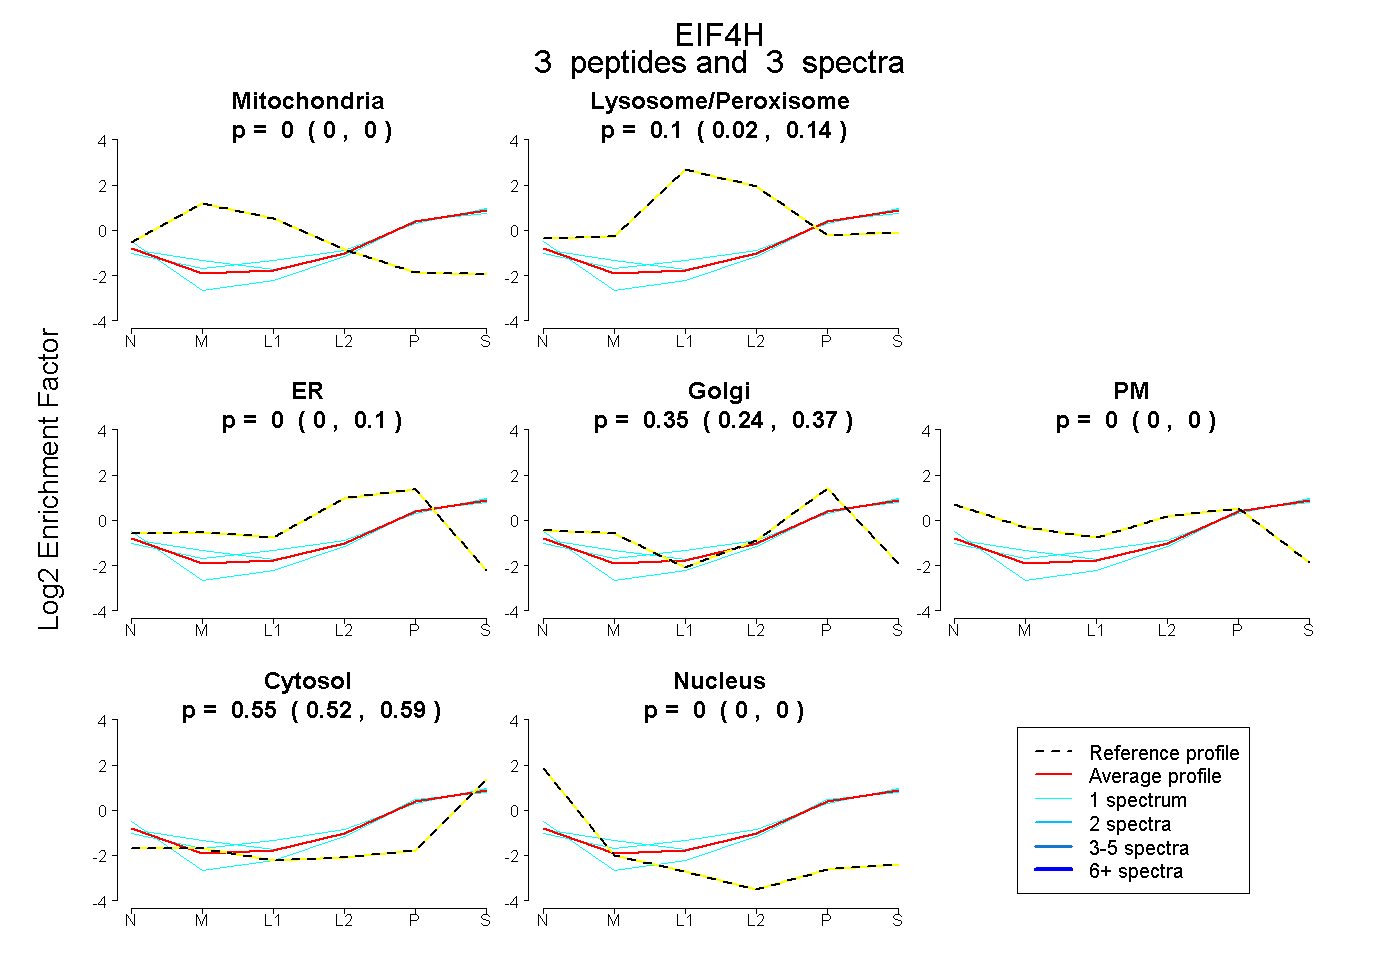
0.000 | 0.000
0.024 | 0.137
0.000 | 0.103
0.235 | 0.375
0.000 | 0.000
0.517 | 0.590
0.000 | 0.000
7peptides
spectra
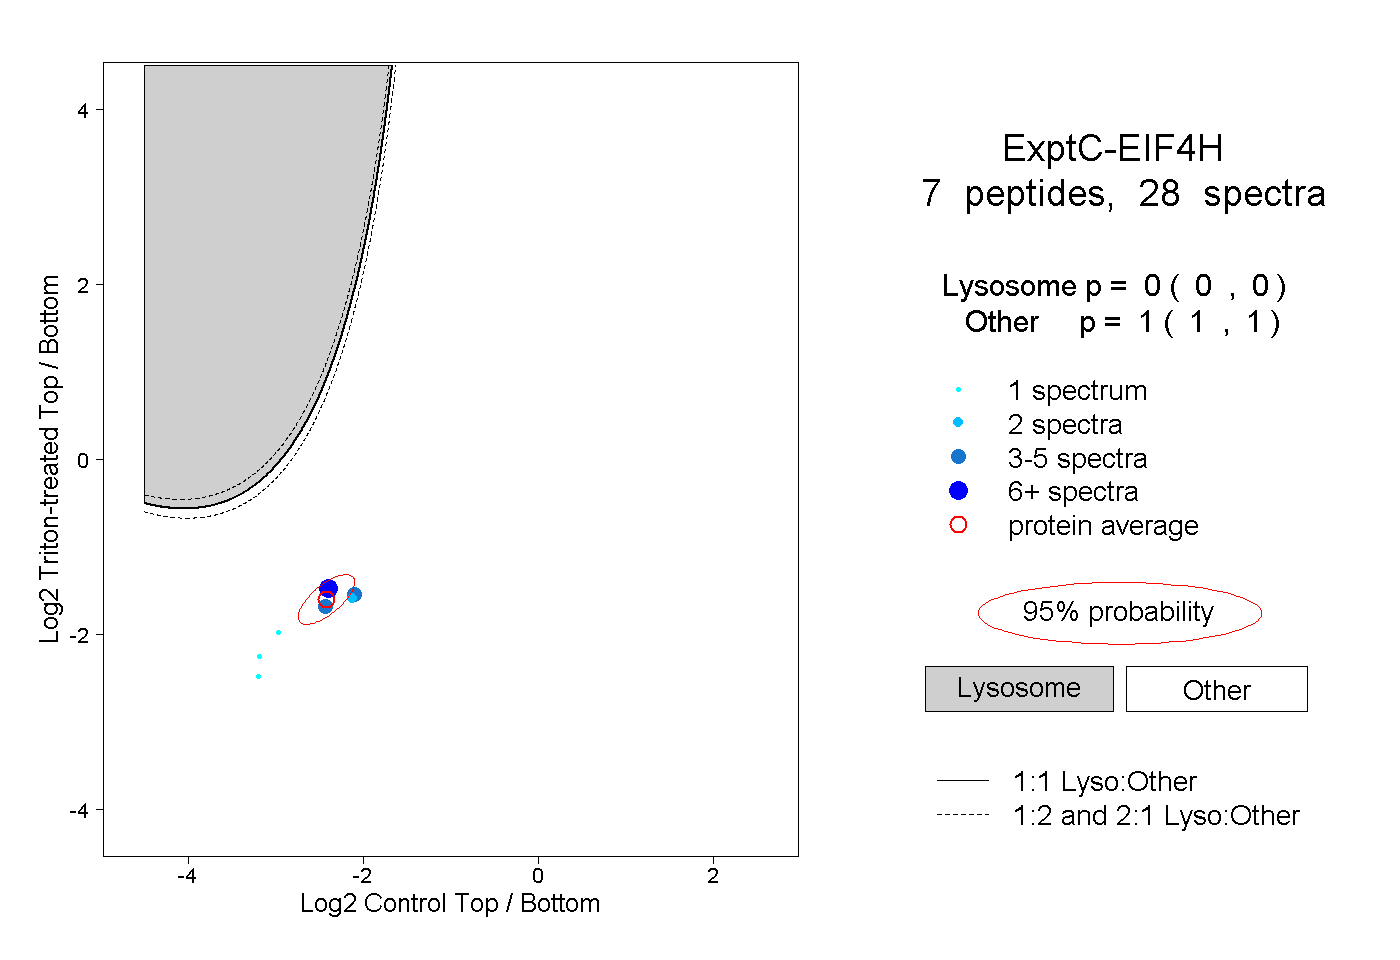
0.000 | 0.000
1.000 | 1.000
1peptide
spectra
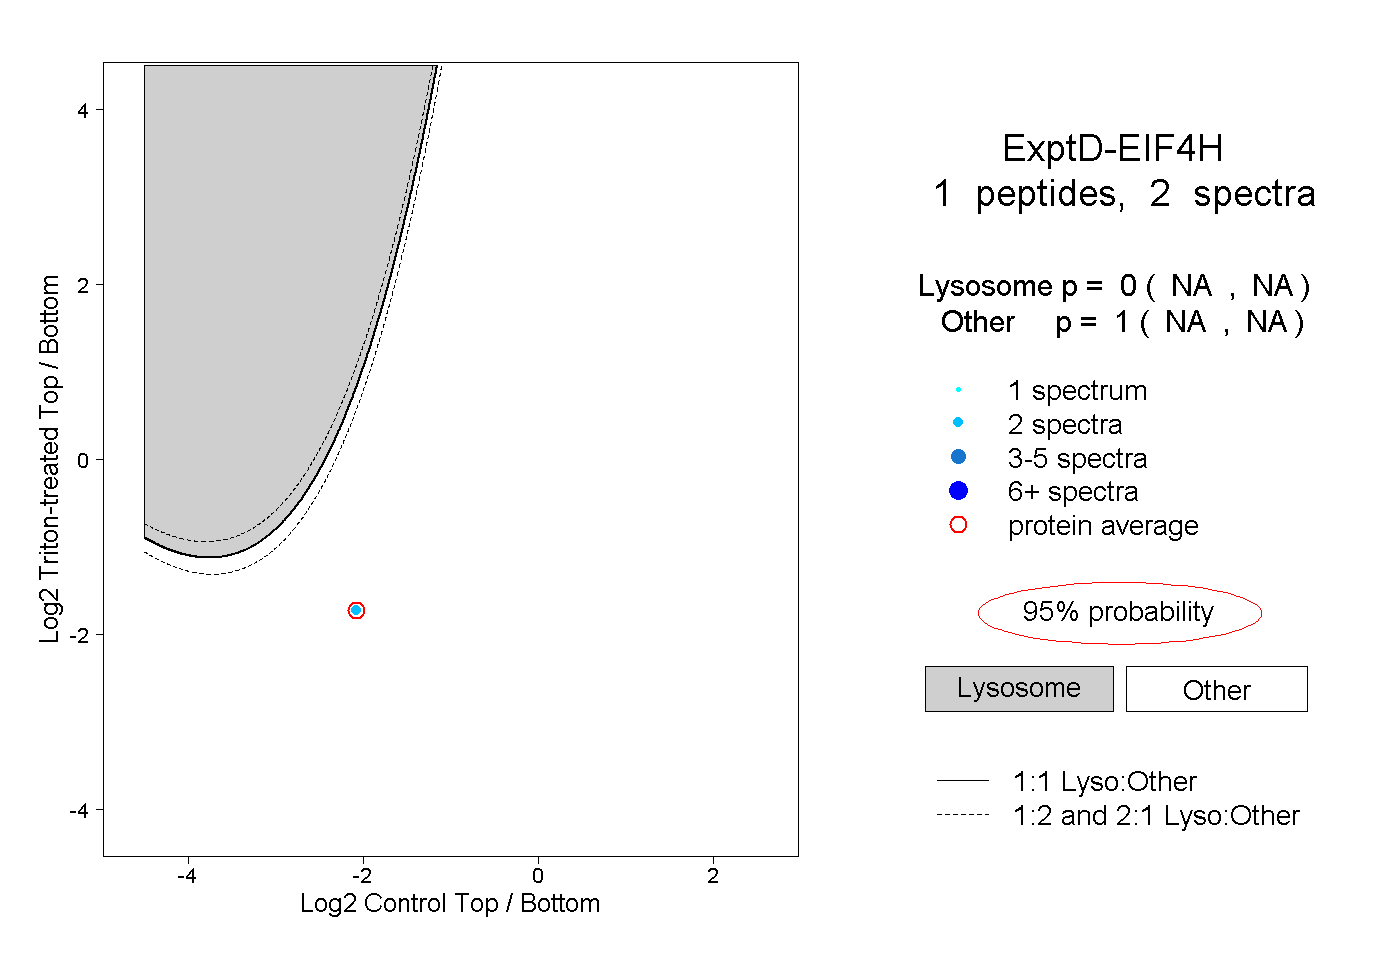
NA | NA
NA | NA