 7
7peptides
spectra
0.000 | 0.000
0.000 | 0.000
0.000 | 0.000
0.001 | 0.033
0.296 | 0.329
0.000 | 0.000
0.660 | 0.674
0.000 | 0.000
| Plot | Mito | Lyso | Perox | ER | Golgi | PM | Cytosol | Nucleus | |||||
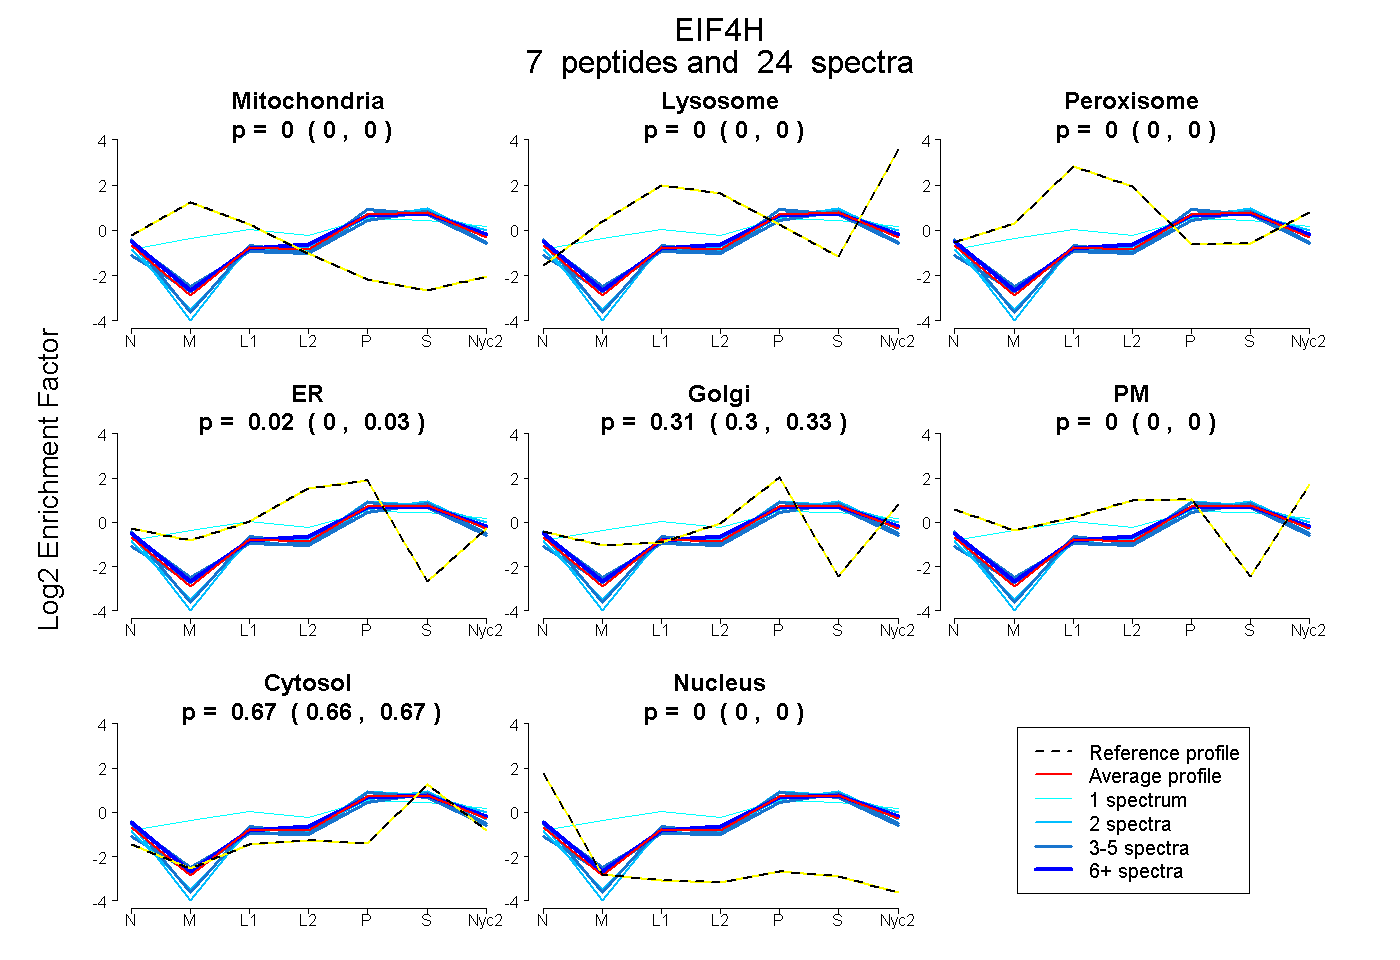
| Expt A |
7 peptides |
24 spectra |
|
0.000 0.000 | 0.000 |
0.000 0.000 | 0.000 |
0.000 0.000 | 0.000 |
0.018 0.001 | 0.033 |
0.314 0.296 | 0.329 |
0.000 0.000 | 0.000 |
0.668 0.660 | 0.674 |
0.000 0.000 | 0.000 |
| 2 spectra, AYSSFGGGR | 0.000 | 0.000 | 0.000 | 0.000 | 0.325 | 0.000 | 0.675 | 0.000 | ||
| 5 spectra, GGFGFR | 0.000 | 0.000 | 0.000 | 0.043 | 0.277 | 0.000 | 0.680 | 0.000 | ||
| 2 spectra, DDFSSGYR | 0.000 | 0.000 | 0.000 | 0.026 | 0.238 | 0.000 | 0.735 | 0.000 | ||
| 5 spectra, AGPPMGSR | 0.000 | 0.000 | 0.000 | 0.000 | 0.311 | 0.000 | 0.689 | 0.000 | ||
| 1 spectrum, DGPPLR | 0.000 | 0.048 | 0.282 | 0.000 | 0.271 | 0.000 | 0.399 | 0.000 | ||
| 3 spectra, EALTYDGALLGDR | 0.000 | 0.000 | 0.000 | 0.010 | 0.289 | 0.000 | 0.701 | 0.000 | ||
| 6 spectra, VDIAEGR | 0.000 | 0.000 | 0.000 | 0.068 | 0.290 | 0.000 | 0.642 | 0.000 |
| Plot | Mito | Lyso or Perox | ER | Golgi | PM | Cytosol | Nucleus | ||||||
| Expt B |
3 peptides |
3 spectra |
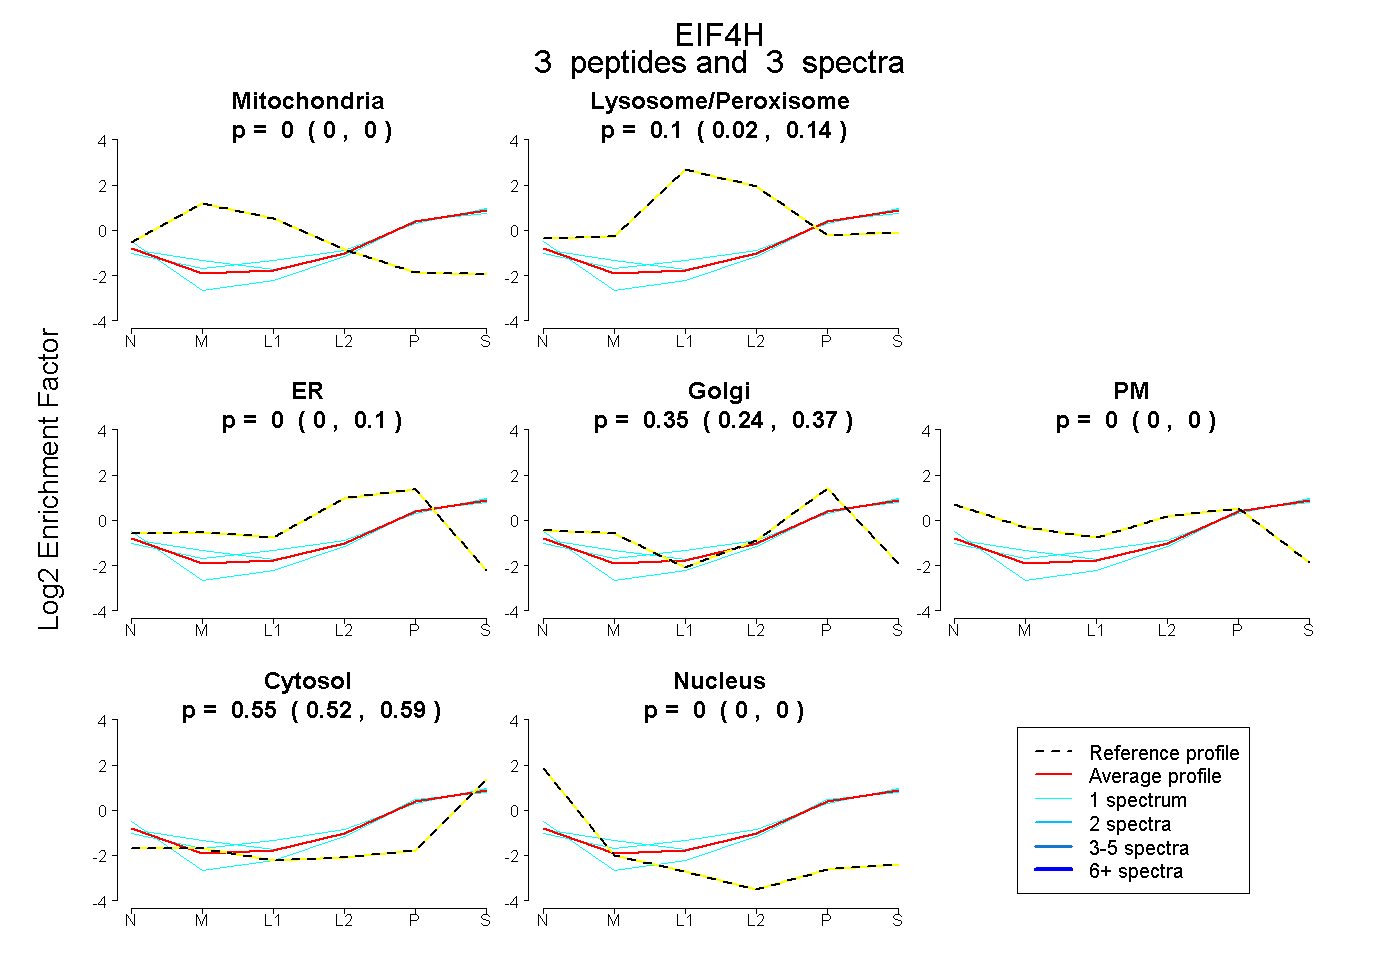 |
0.000 0.000 | 0.000 |
0.103 0.024 | 0.137 |
0.000 0.000 | 0.103 |
0.351 0.235 | 0.375 |
0.000 0.000 | 0.000 |
0.547 0.517 | 0.590 |
0.000 0.000 | 0.000 |
|||
| Plot | Lyso | Other | |||||||||||
| Expt C |
7 peptides |
28 spectra |
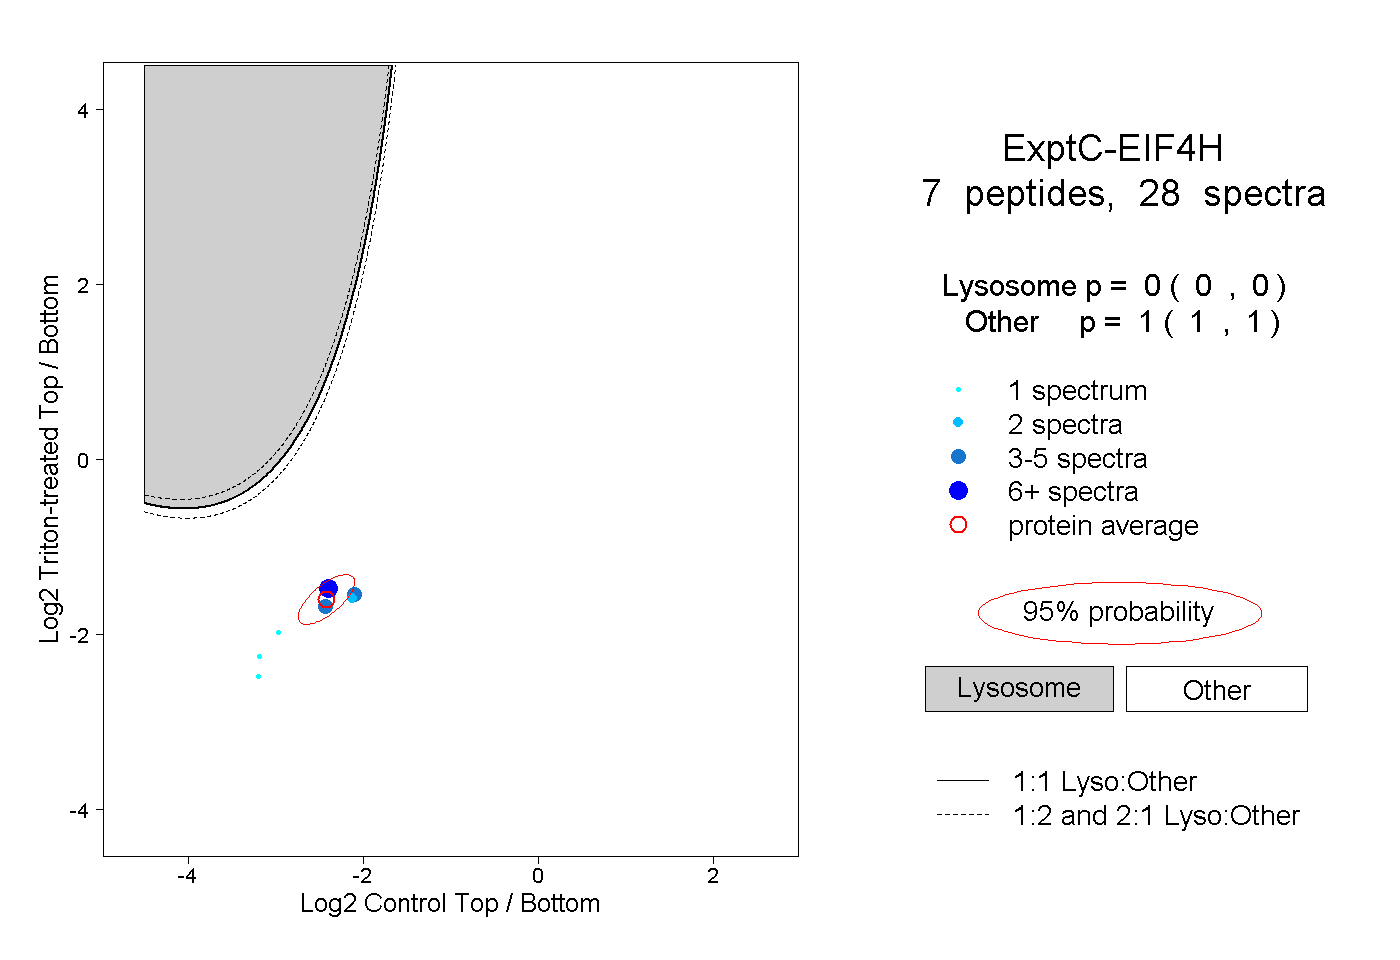 |
0.000 0.000 | 0.000 |
1.000 1.000 | 1.000 |
||||||||
| Plot | Lyso | Other | |||||||||||
| Expt D |
1 peptide |
2 spectra |
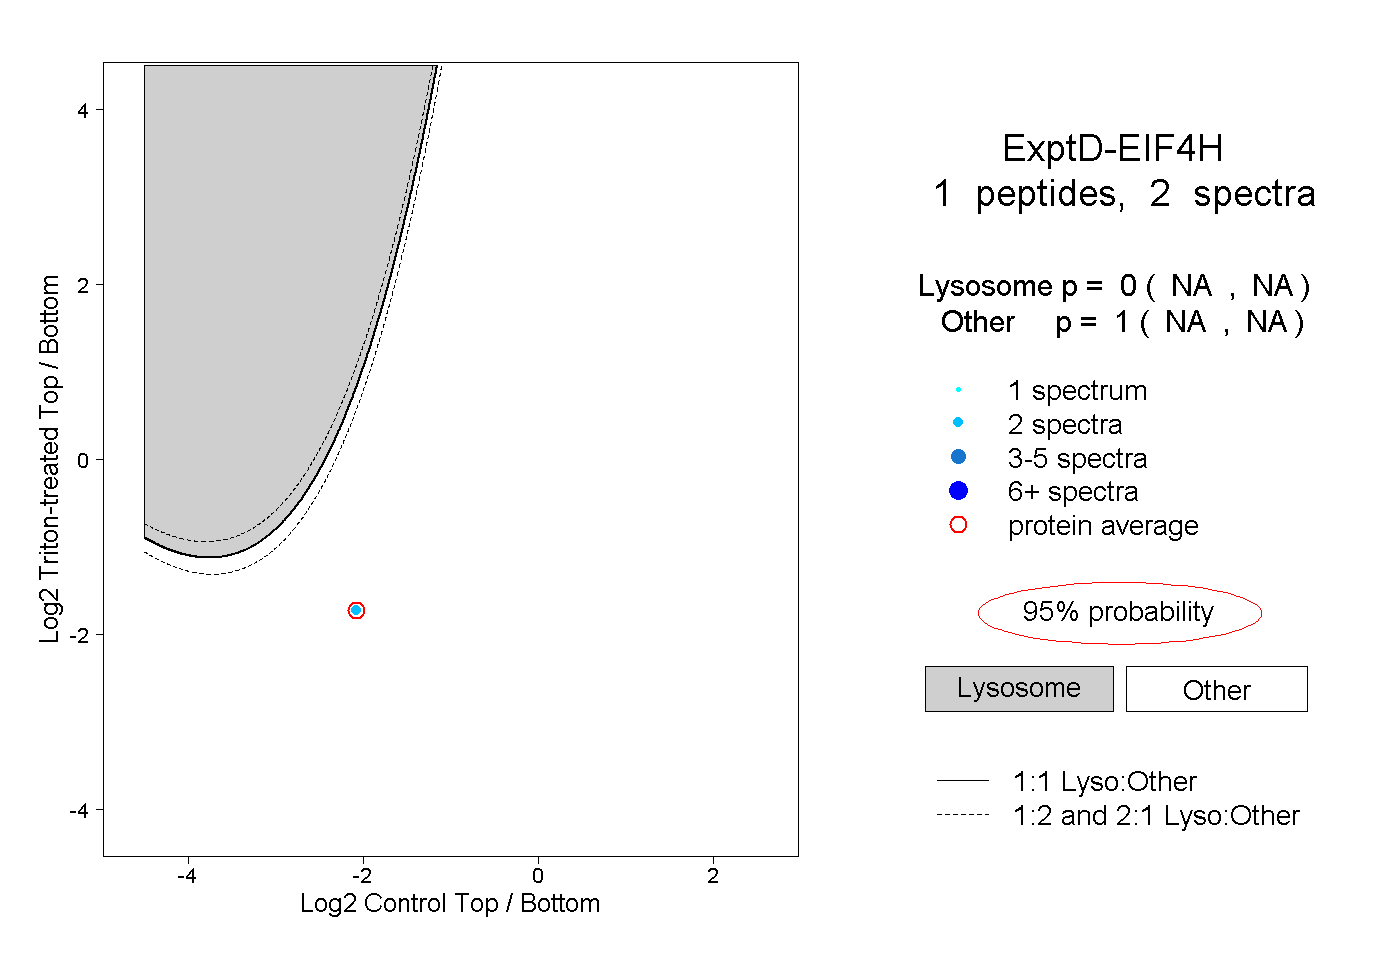 |
0.000 NA | NA |
1.000 NA | NA |