 13
13peptides
spectra
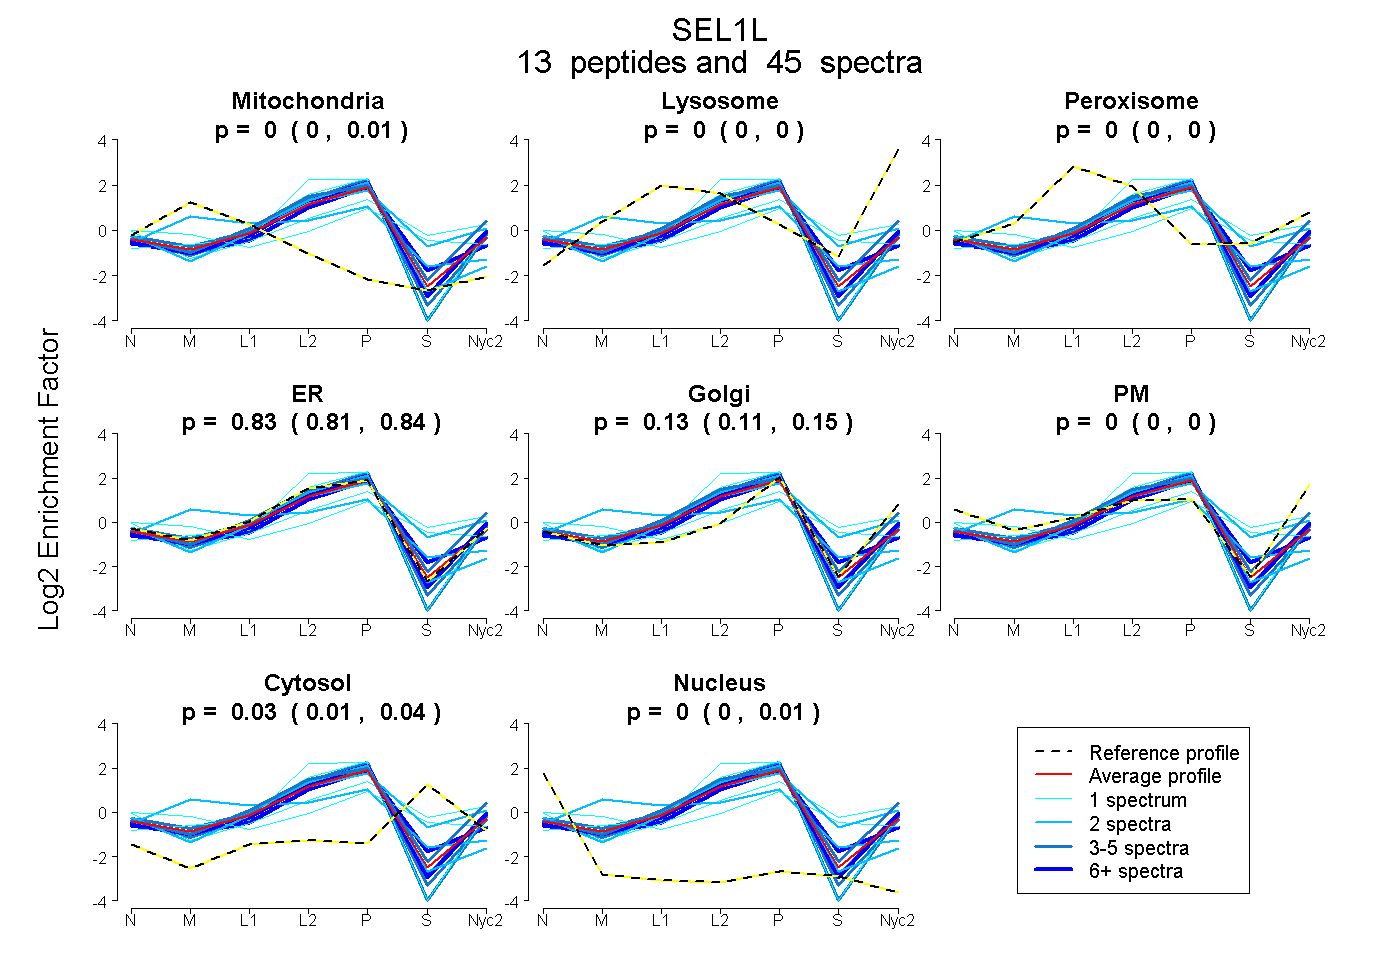
0.000 | 0.012
0.000 | 0.000
0.000 | 0.000
0.808 | 0.845
0.112 | 0.150
0.000 | 0.000
0.013 | 0.043
0.000 | 0.011
6peptides
spectra
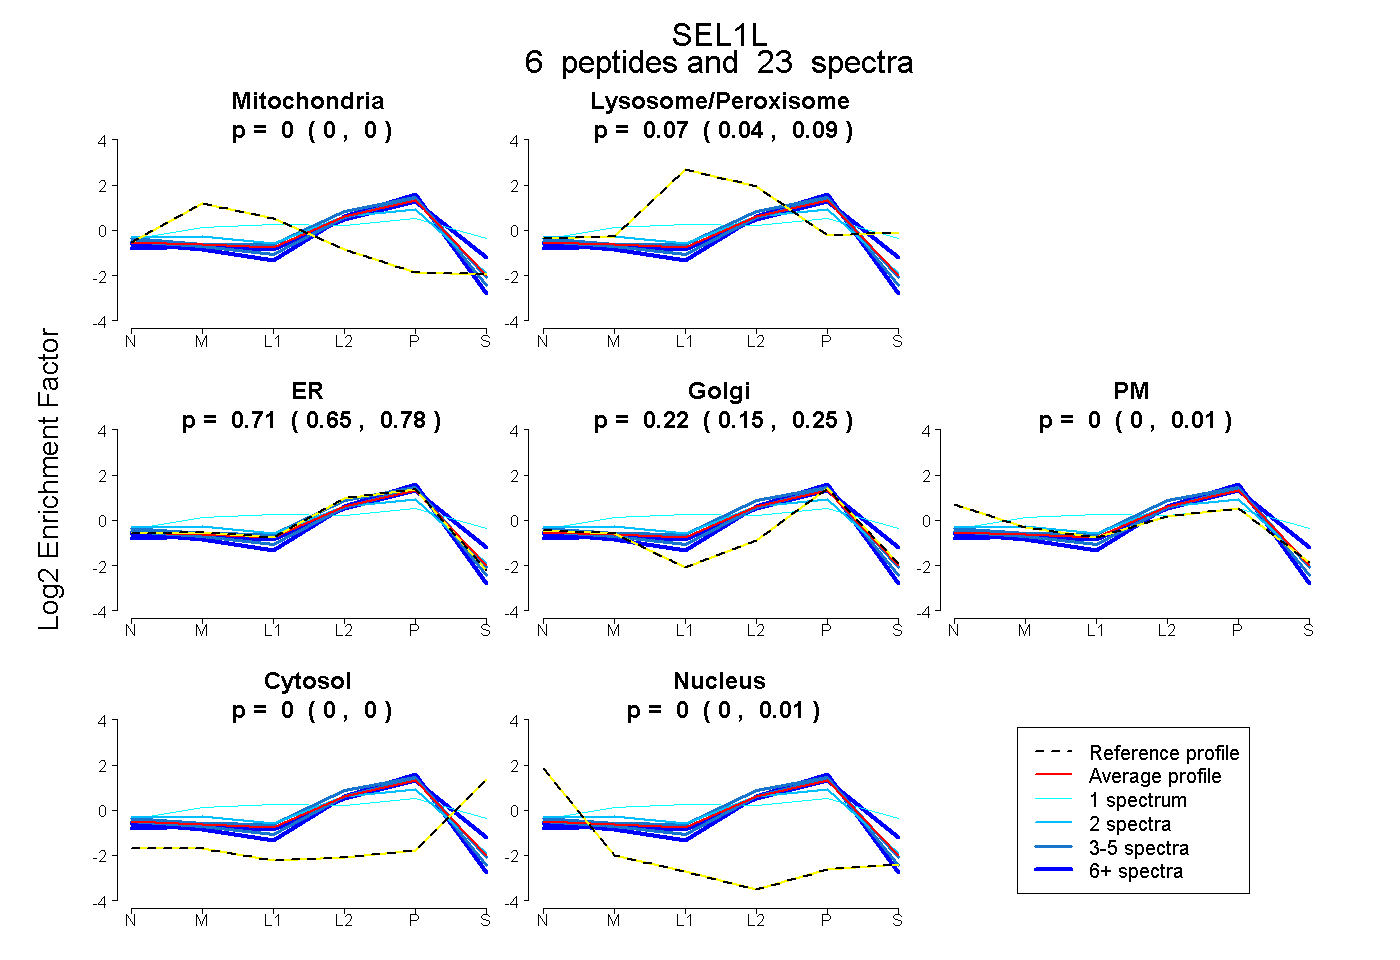
0.000 | 0.000
0.037 | 0.093
0.646 | 0.784
0.152 | 0.252
0.000 | 0.008
0.000 | 0.000
0.000 | 0.012
11peptides
spectra
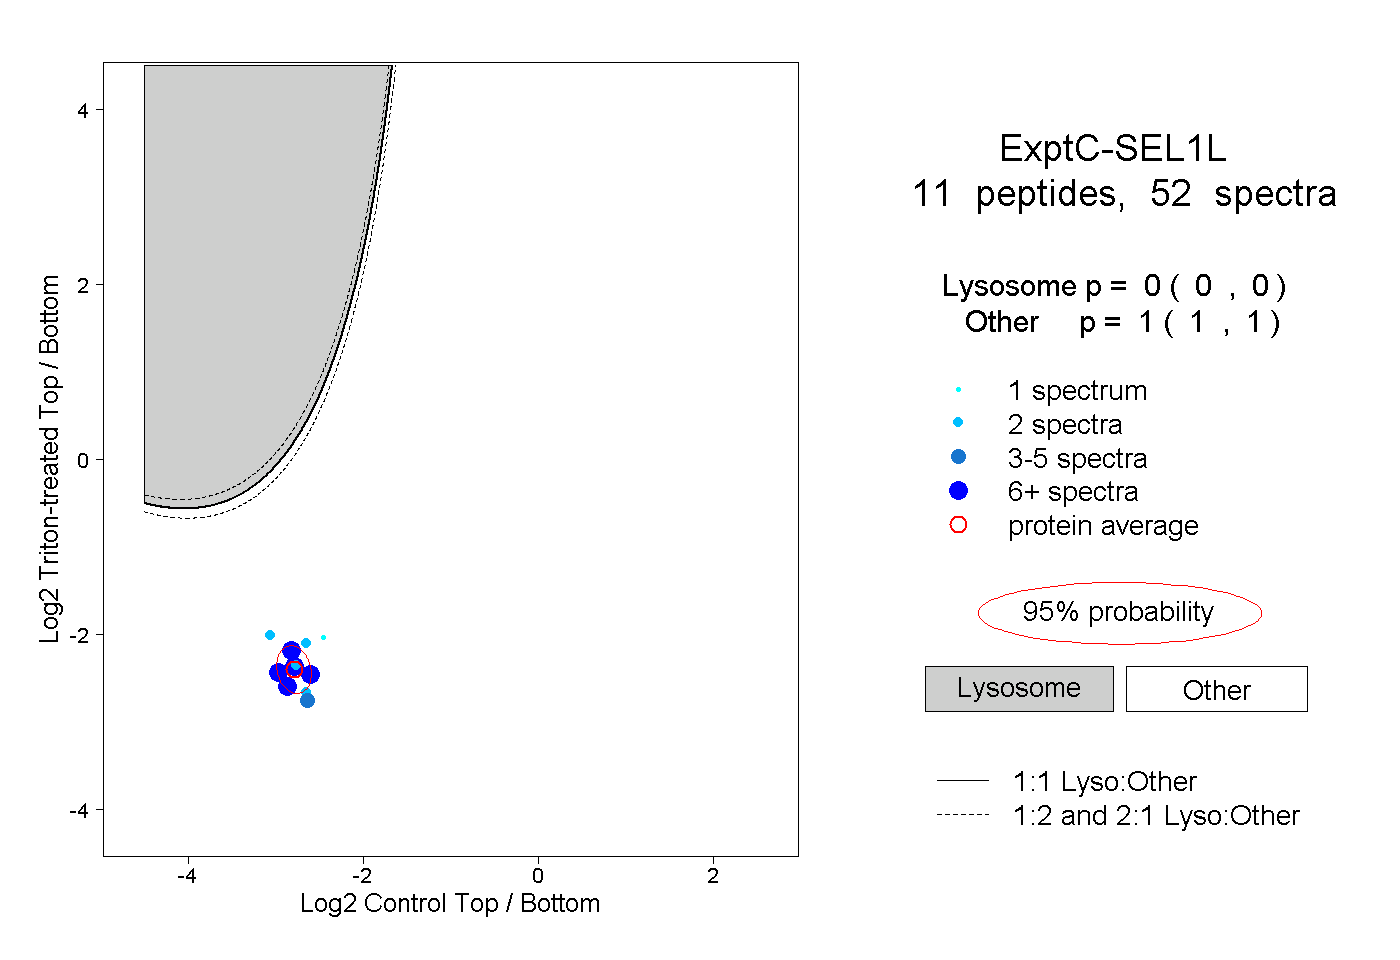
0.000 | 0.000
1.000 | 1.000
7peptides
spectra
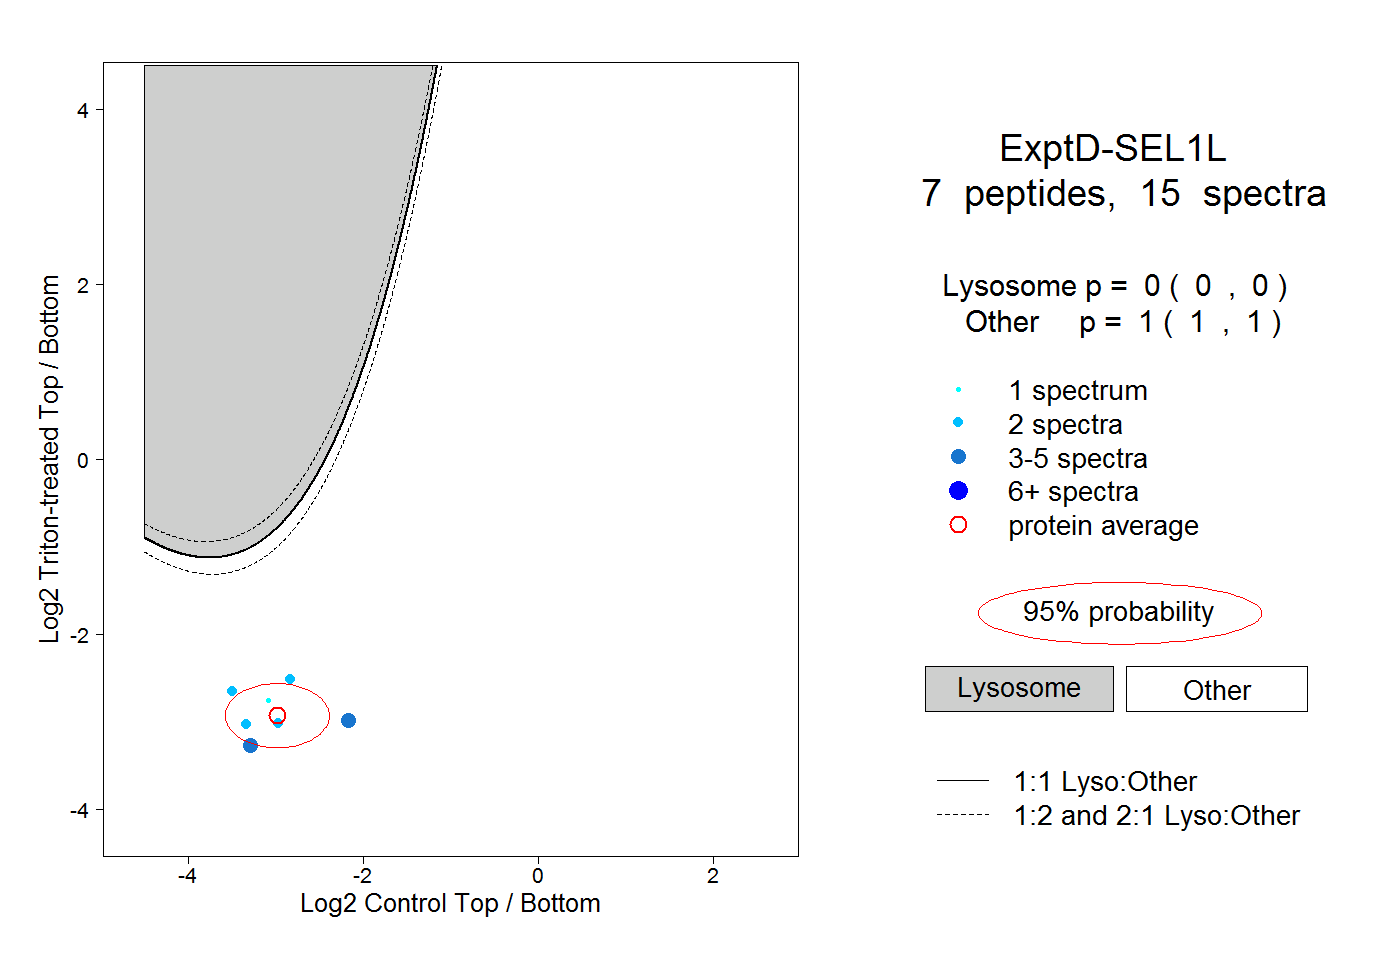
0.000 | 0.000
1.000 | 1.000