 38
38peptides
spectra
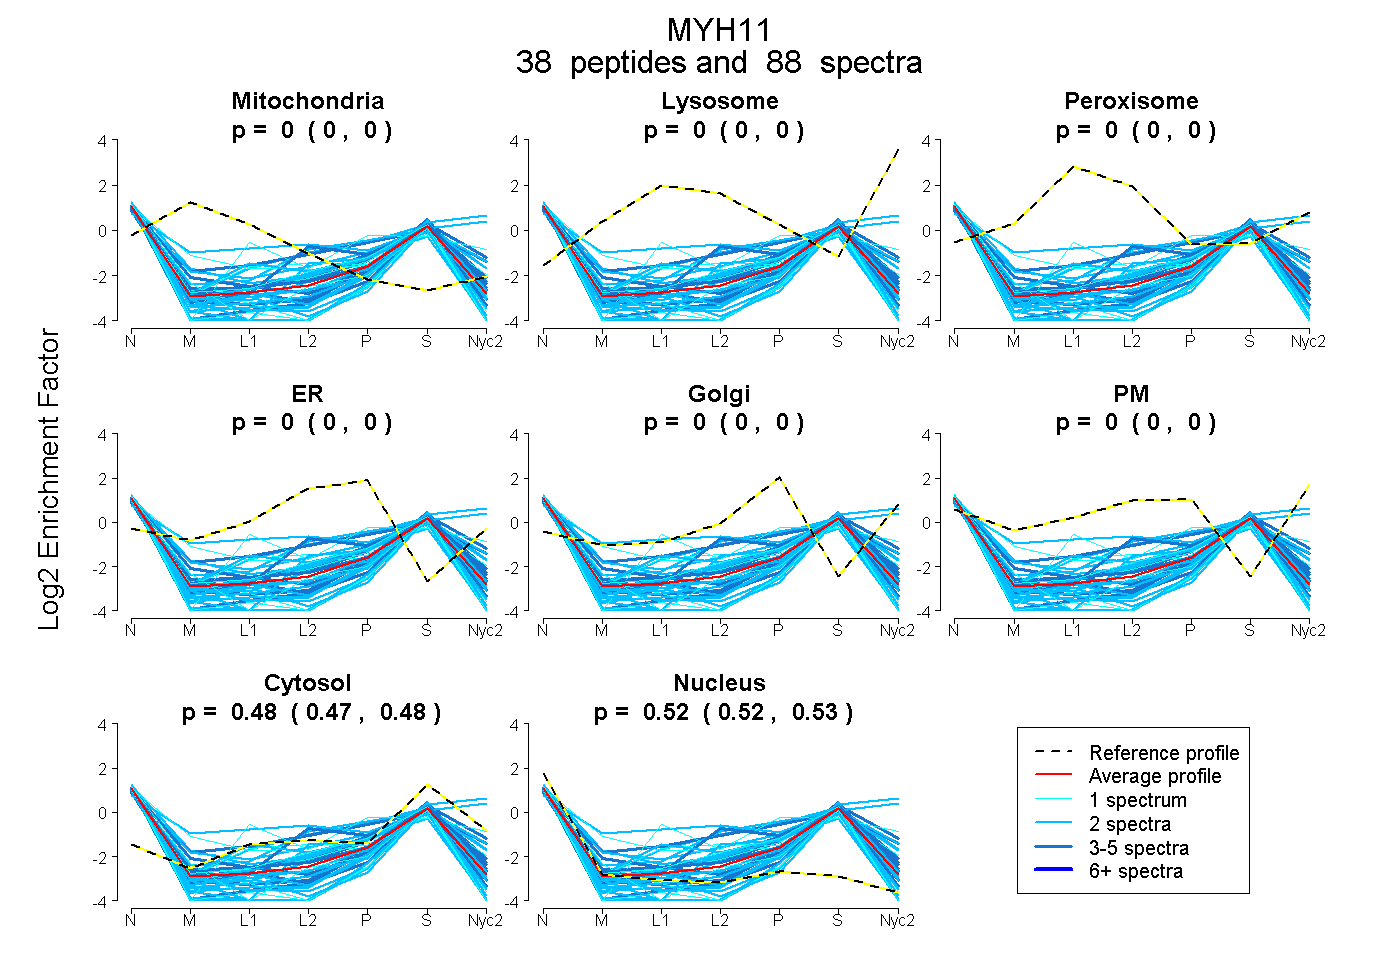
0.000 | 0.000
0.000 | 0.000
0.000 | 0.000
0.000 | 0.000
0.000 | 0.000
0.000 | 0.000
0.472 | 0.478
0.521 | 0.527
5peptides
spectra
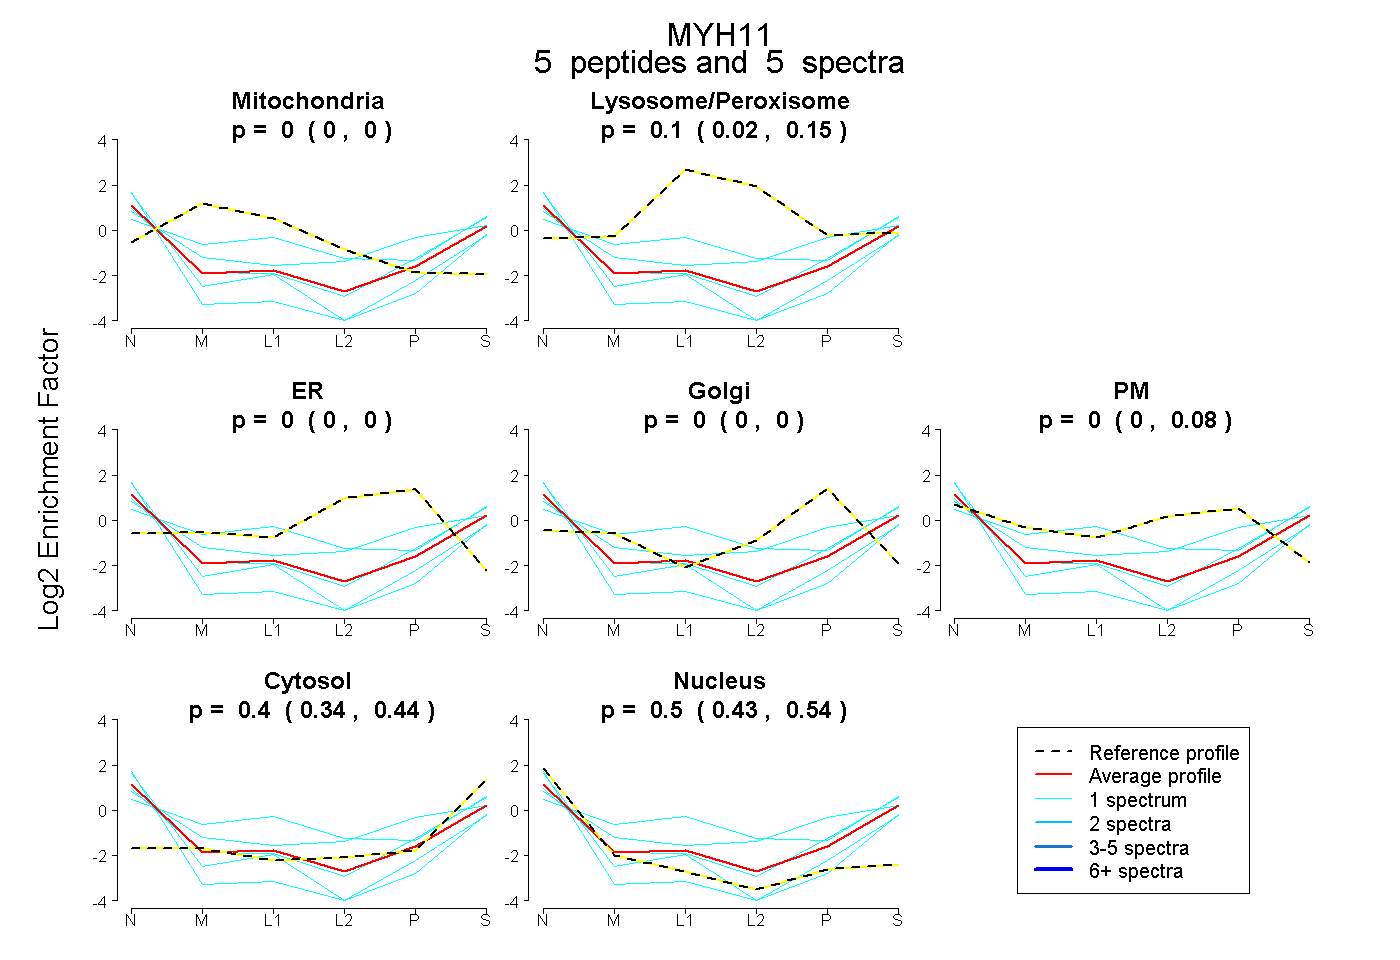
0.000 | 0.000
0.016 | 0.151
0.000 | 0.000
0.000 | 0.000
0.000 | 0.081
0.338 | 0.442
0.433 | 0.539
1peptide
spectrum
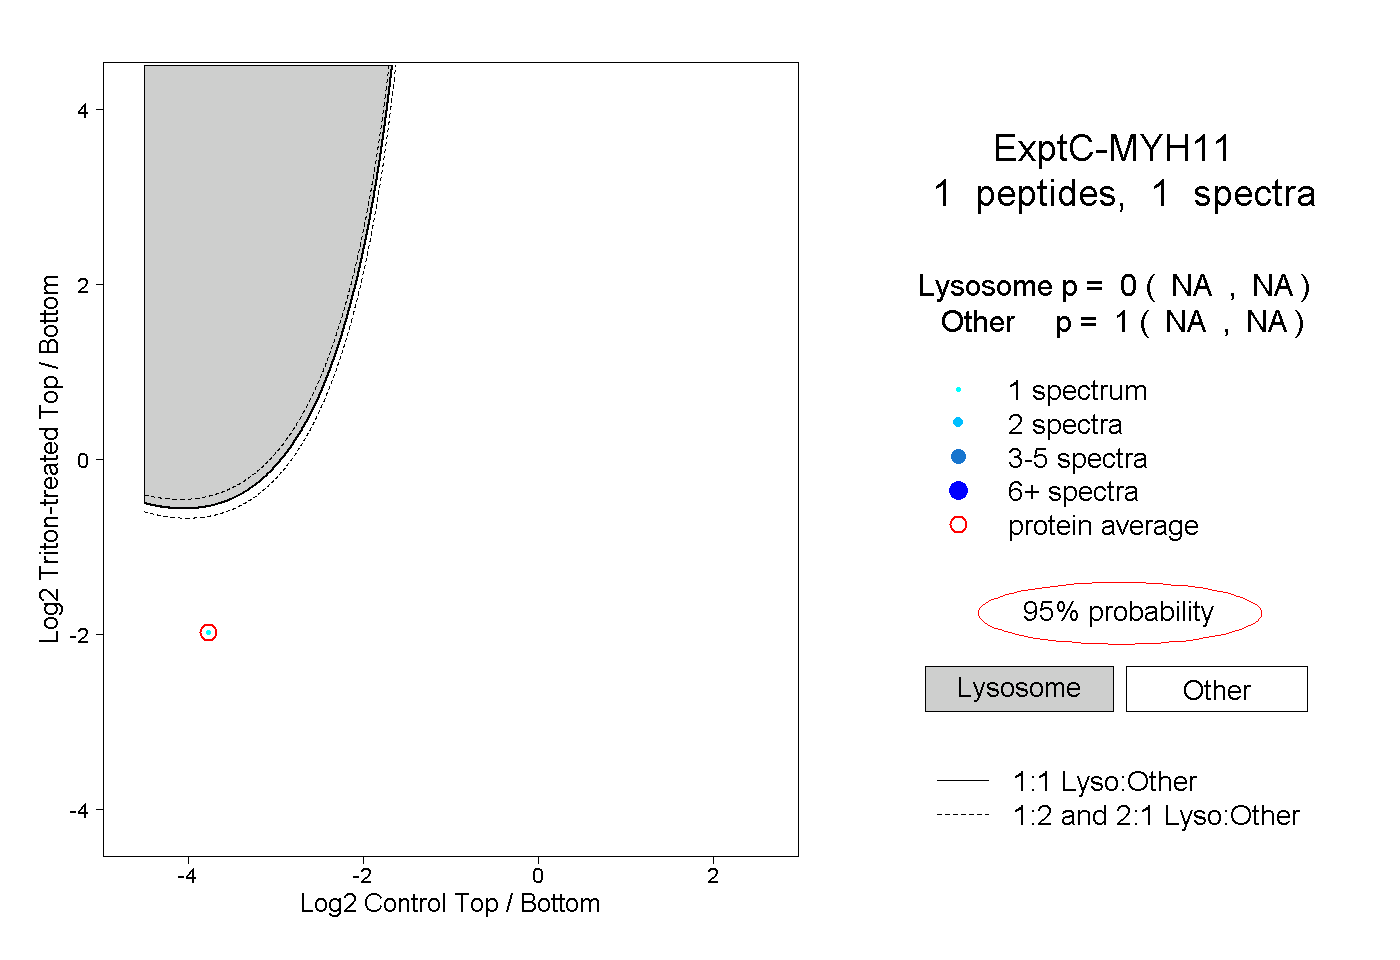
NA | NA
NA | NA