 4
4peptides
spectra
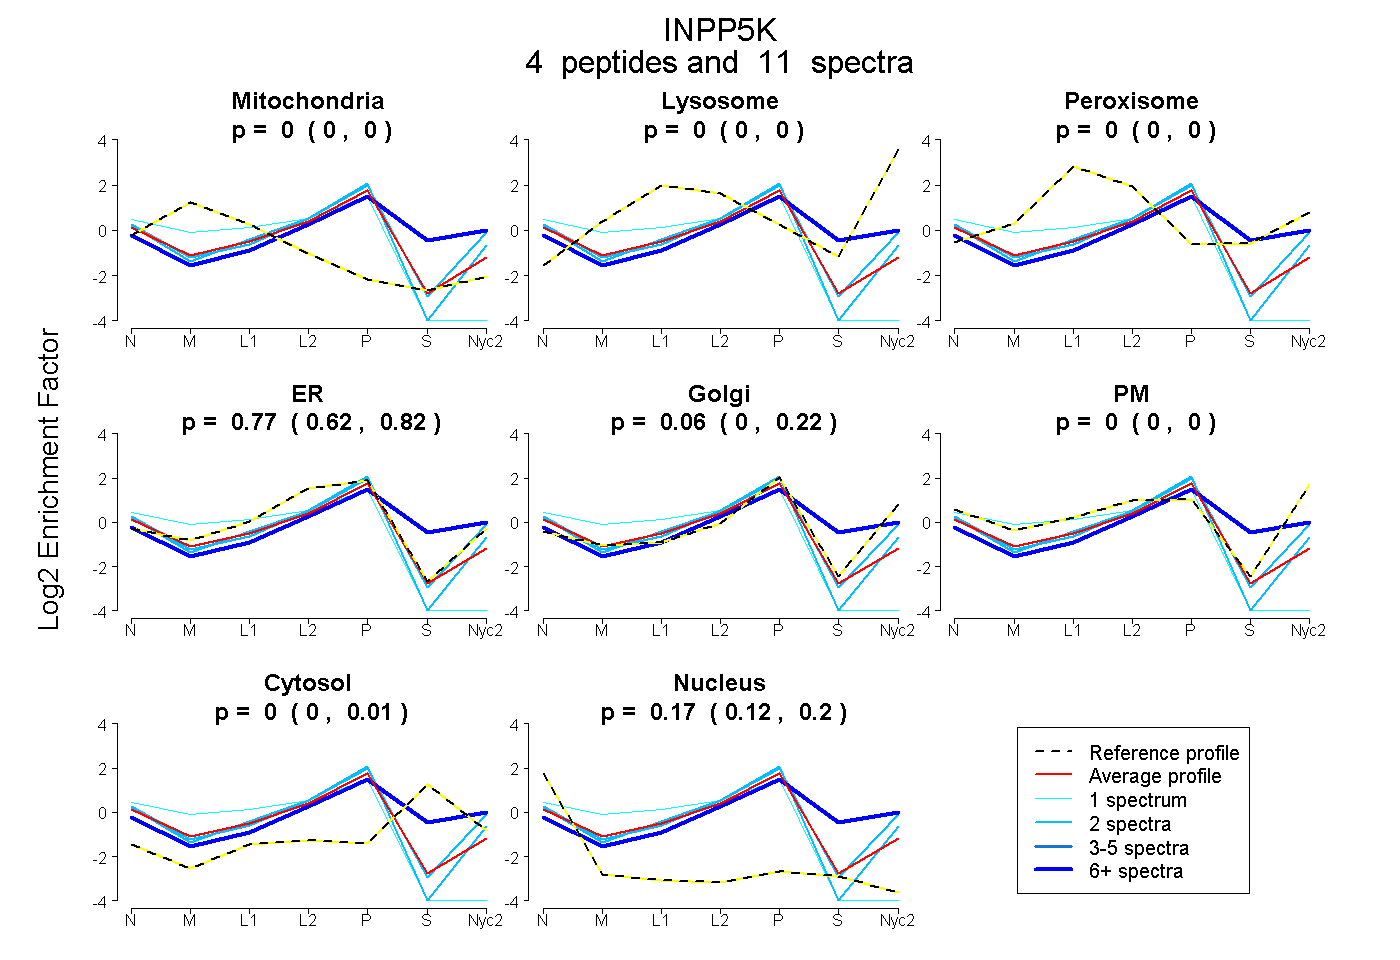
0.000 | 0.000
0.000 | 0.000
0.000 | 0.000
0.622 | 0.821
0.000 | 0.220
0.000 | 0.000
0.000 | 0.008
0.118 | 0.195
3peptides
spectra
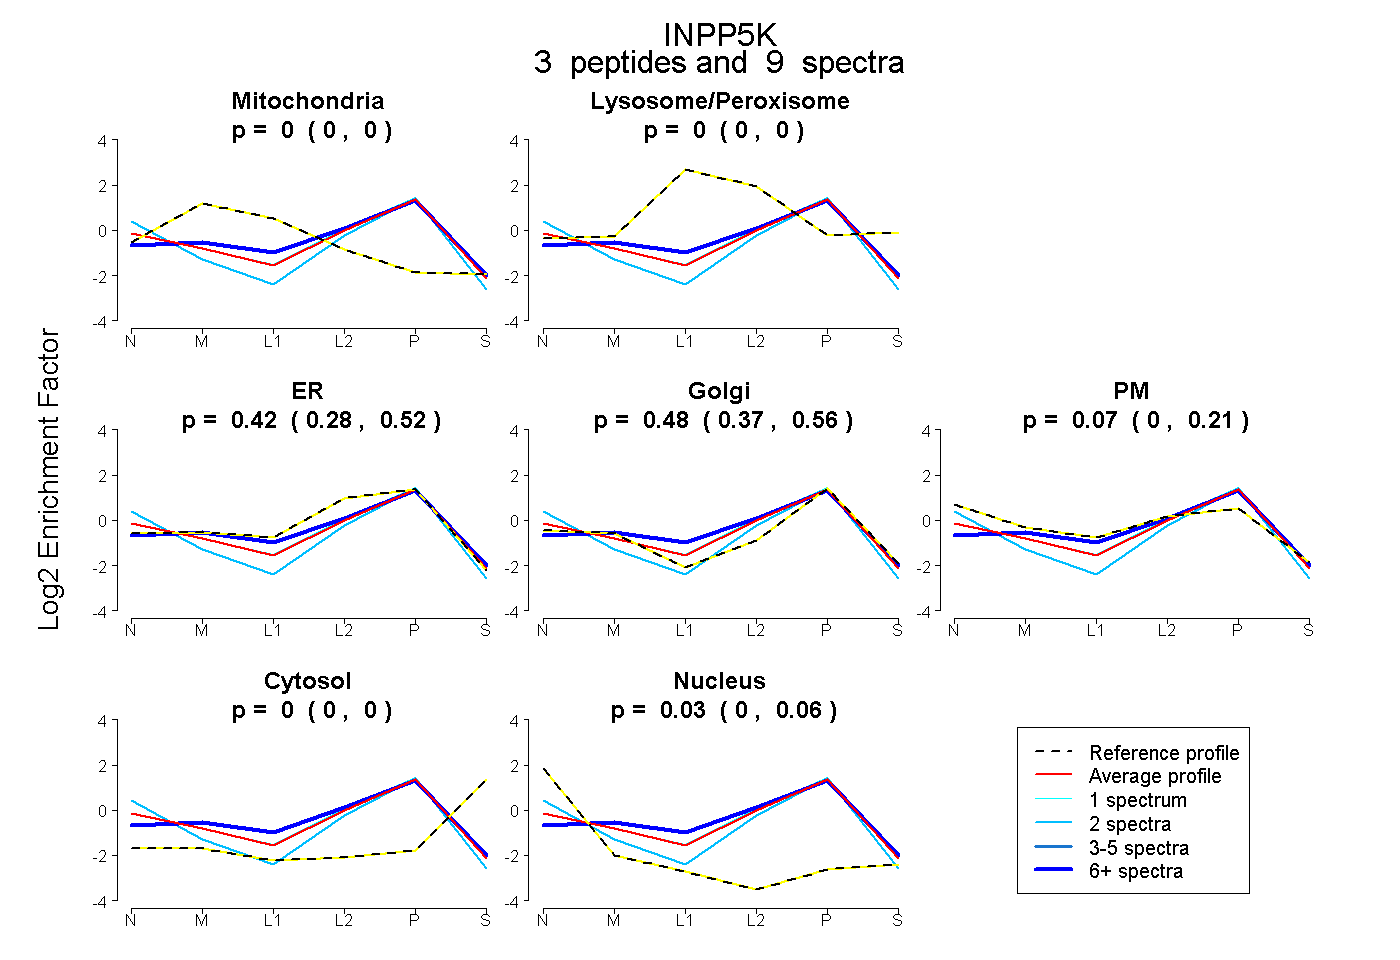
0.000 | 0.000
0.000 | 0.000
0.278 | 0.517
0.371 | 0.563
0.000 | 0.207
0.000 | 0.000
0.000 | 0.061
5peptides
spectra
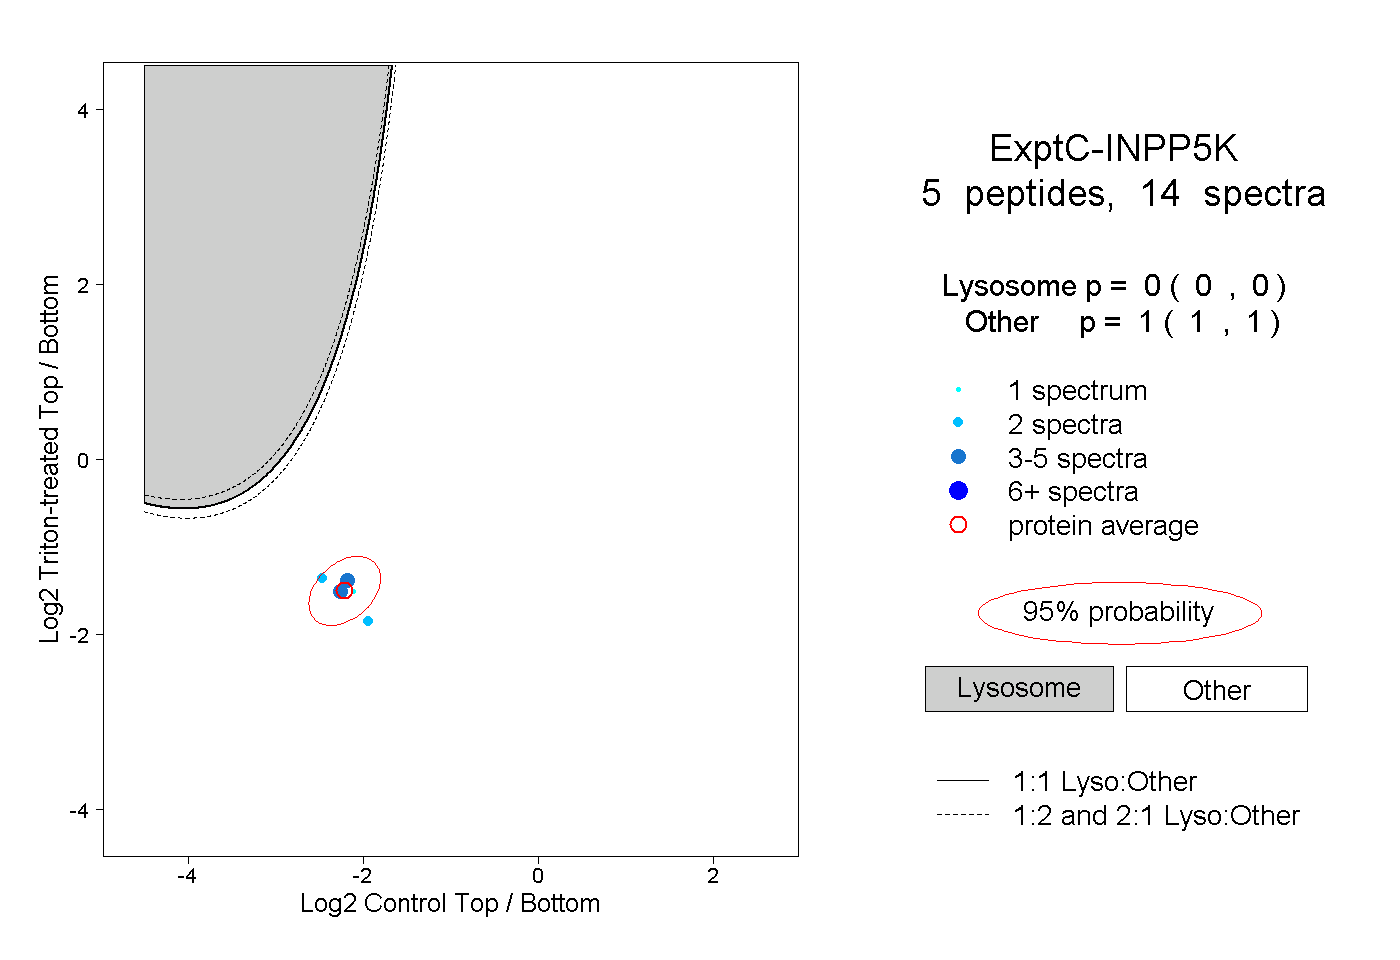
0.000 | 0.000
1.000 | 1.000
1peptide
spectra
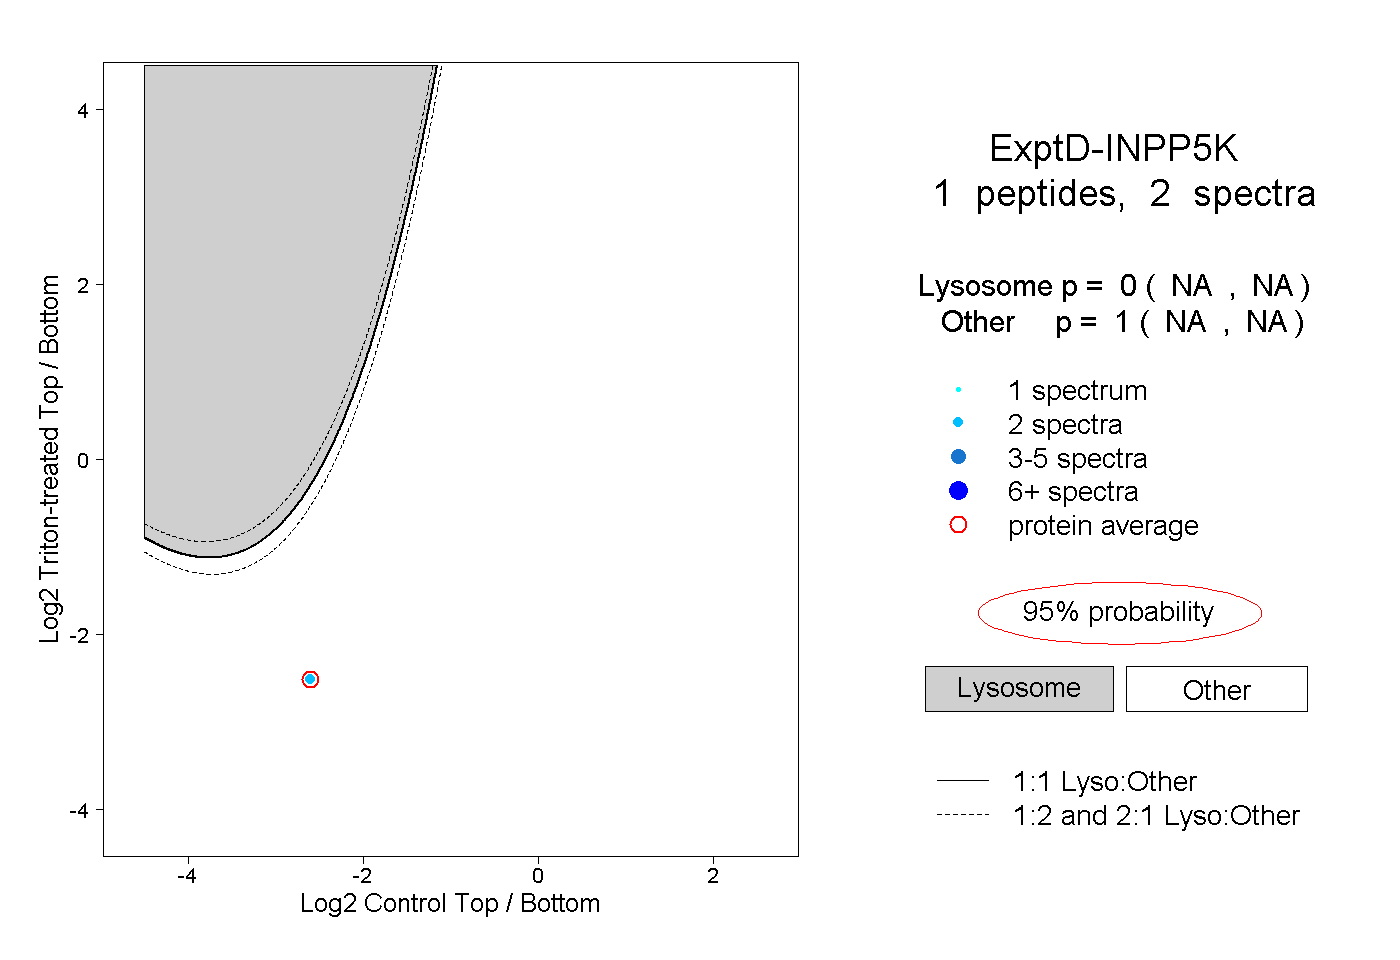
NA | NA
NA | NA