 4
4peptides
spectra
0.000 | 0.000
0.000 | 0.000
0.000 | 0.000
0.622 | 0.821
0.000 | 0.220
0.000 | 0.000
0.000 | 0.008
0.118 | 0.195
| Plot | Mito | Lyso | Perox | ER | Golgi | PM | Cytosol | Nucleus | |||||
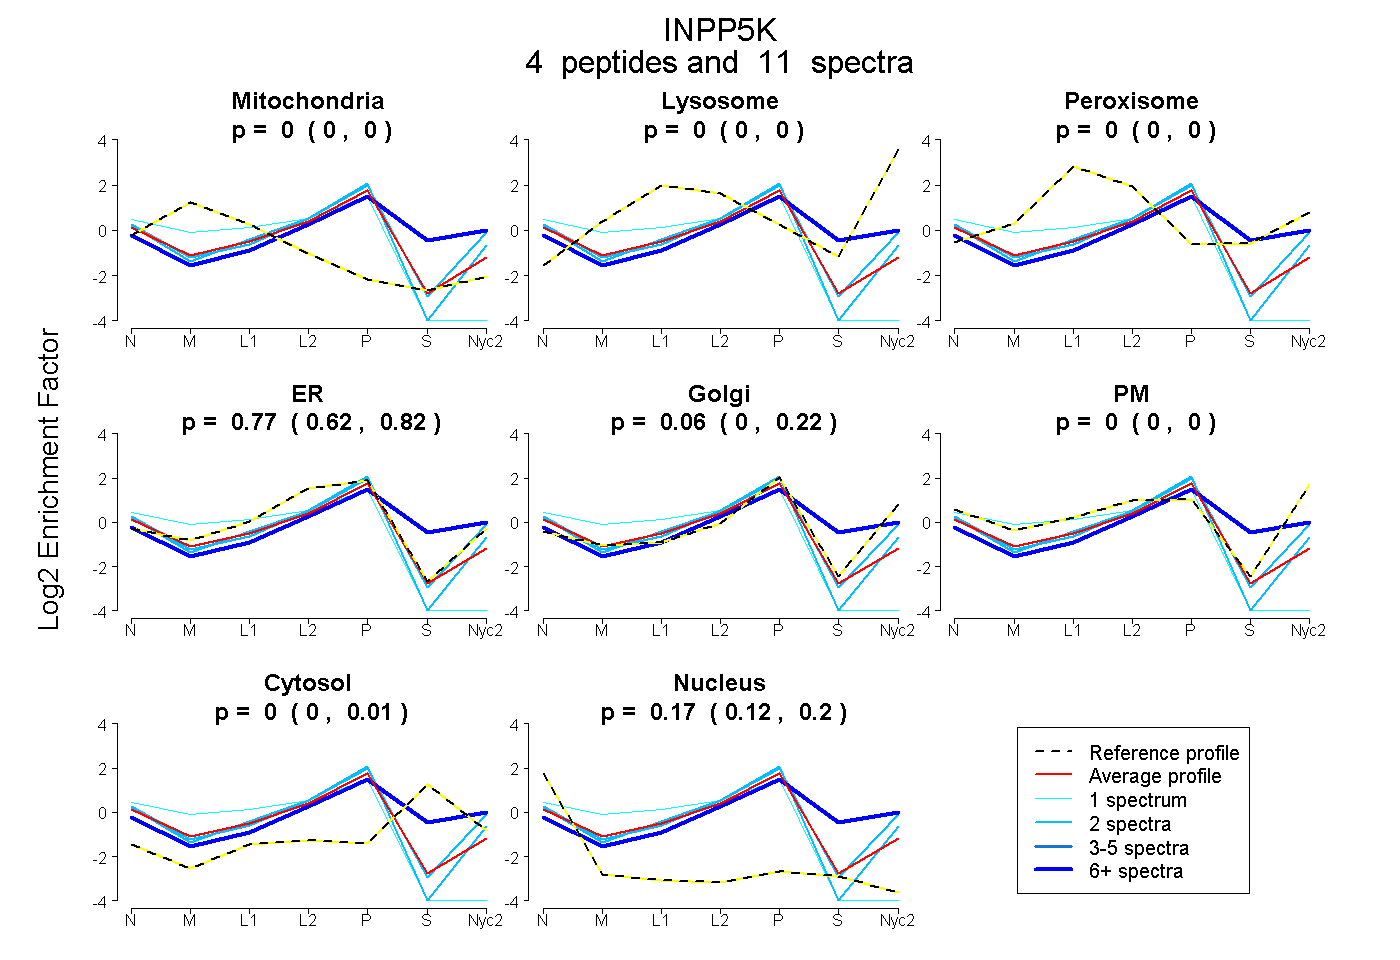
| Expt A |
4 peptides |
11 spectra |
|
0.000 0.000 | 0.000 |
0.000 0.000 | 0.000 |
0.000 0.000 | 0.000 |
0.774 0.622 | 0.821 |
0.060 0.000 | 0.220 |
0.000 0.000 | 0.000 |
0.000 0.000 | 0.008 |
0.166 0.118 | 0.195 |
| 2 spectra, IPSGFFLR | 0.000 | 0.000 | 0.000 | 0.708 | 0.173 | 0.000 | 0.000 | 0.119 | ||
| 1 spectrum, IEDFGLLFVQECITK | 0.230 | 0.000 | 0.000 | 0.603 | 0.000 | 0.000 | 0.000 | 0.167 | ||
| 2 spectra, ANPSGFLLTQK | 0.000 | 0.000 | 0.000 | 0.539 | 0.391 | 0.000 | 0.000 | 0.070 | ||
| 6 spectra, LEHFDR | 0.000 | 0.000 | 0.000 | 0.295 | 0.368 | 0.000 | 0.337 | 0.000 |
| Plot | Mito | Lyso or Perox | ER | Golgi | PM | Cytosol | Nucleus | ||||||
| Expt B |
3 peptides |
9 spectra |
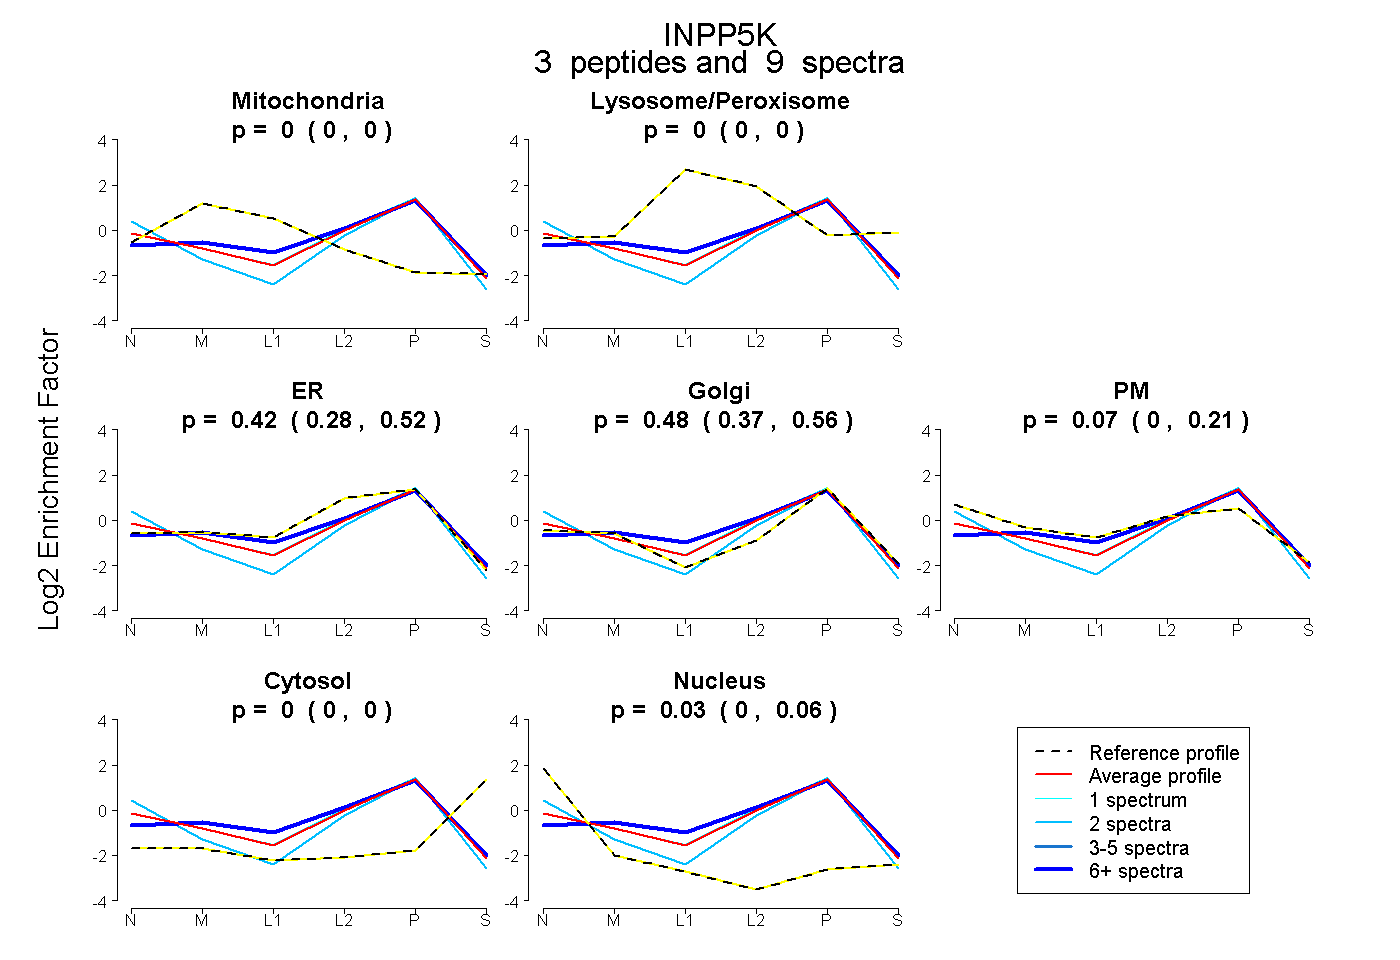 |
0.000 0.000 | 0.000 |
0.000 0.000 | 0.000 |
0.421 0.278 | 0.517 |
0.475 0.371 | 0.563 |
0.072 0.000 | 0.207 |
0.000 0.000 | 0.000 |
0.031 0.000 | 0.061 |
|||
| Plot | Lyso | Other | |||||||||||
| Expt C |
5 peptides |
14 spectra |
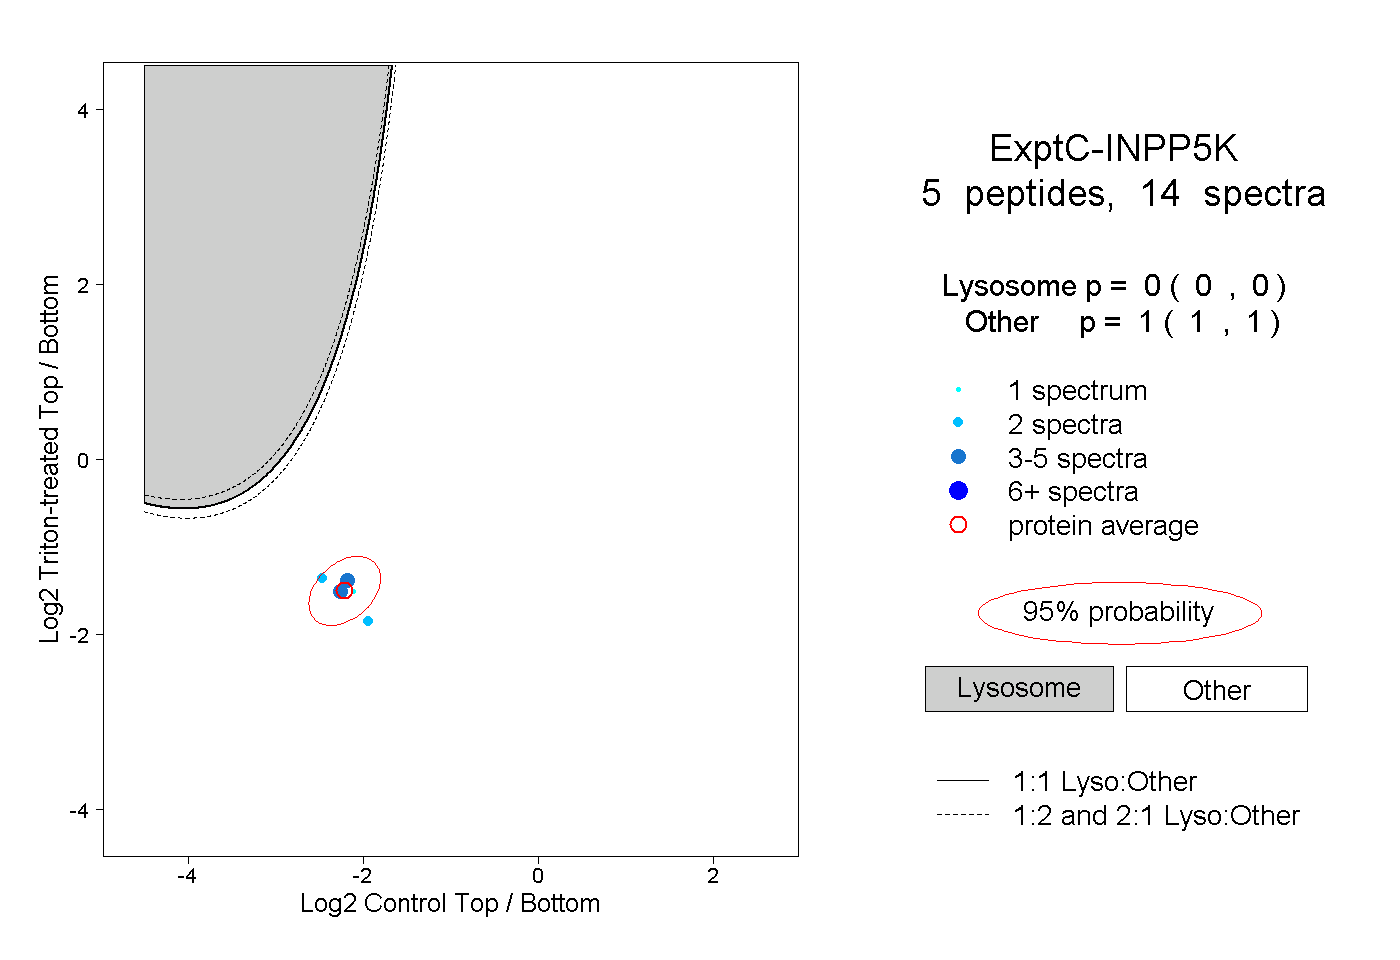 |
0.000 0.000 | 0.000 |
1.000 1.000 | 1.000 |
||||||||
| Plot | Lyso | Other | |||||||||||
| Expt D |
1 peptide |
2 spectra |
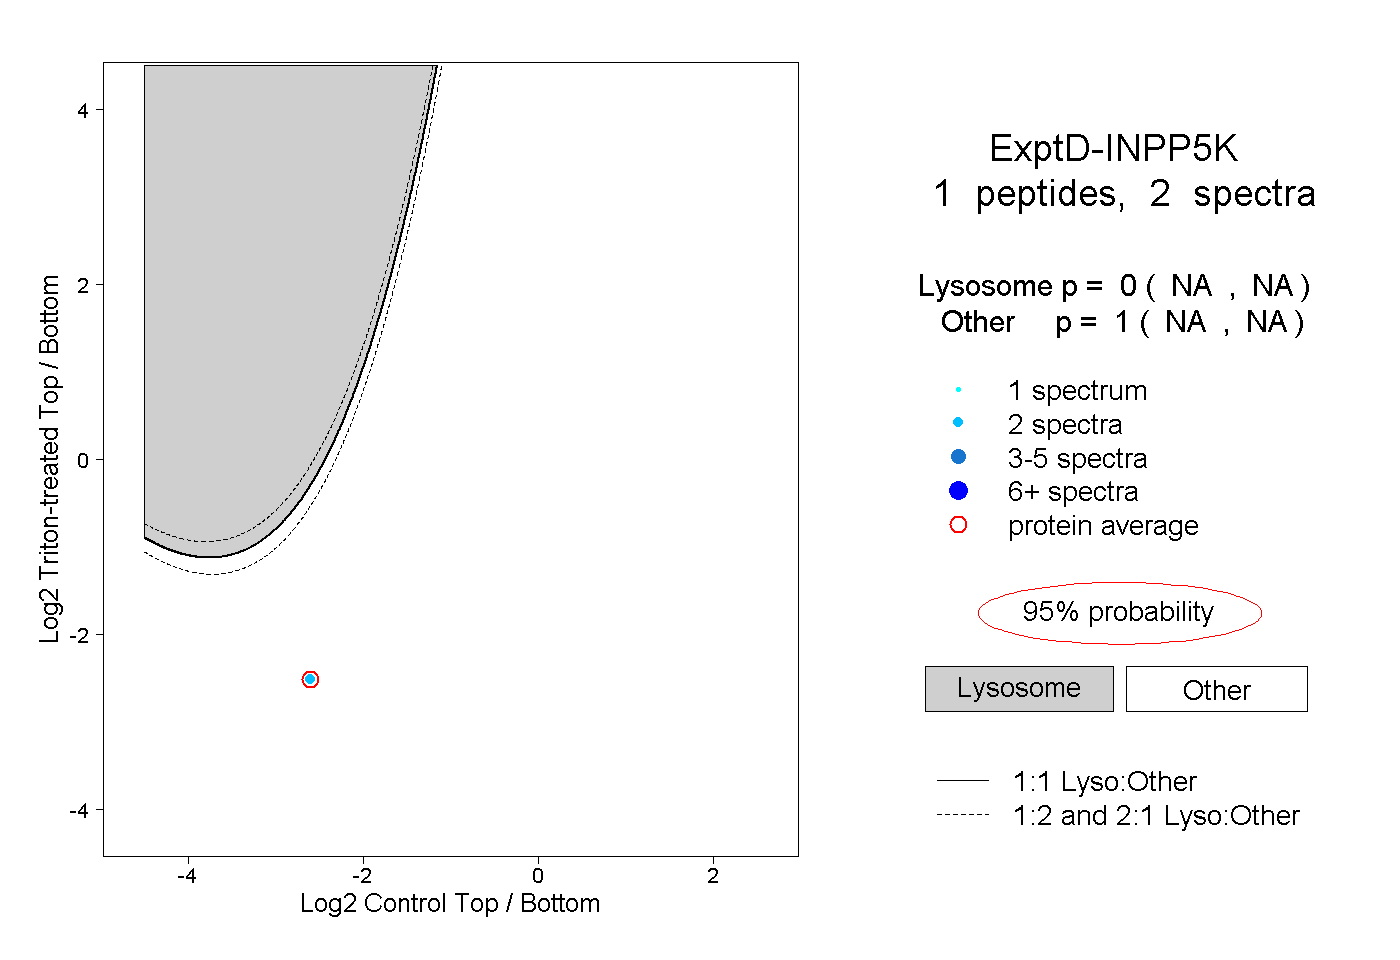 |
0.000 NA | NA |
1.000 NA | NA |