 7
7peptides
spectra
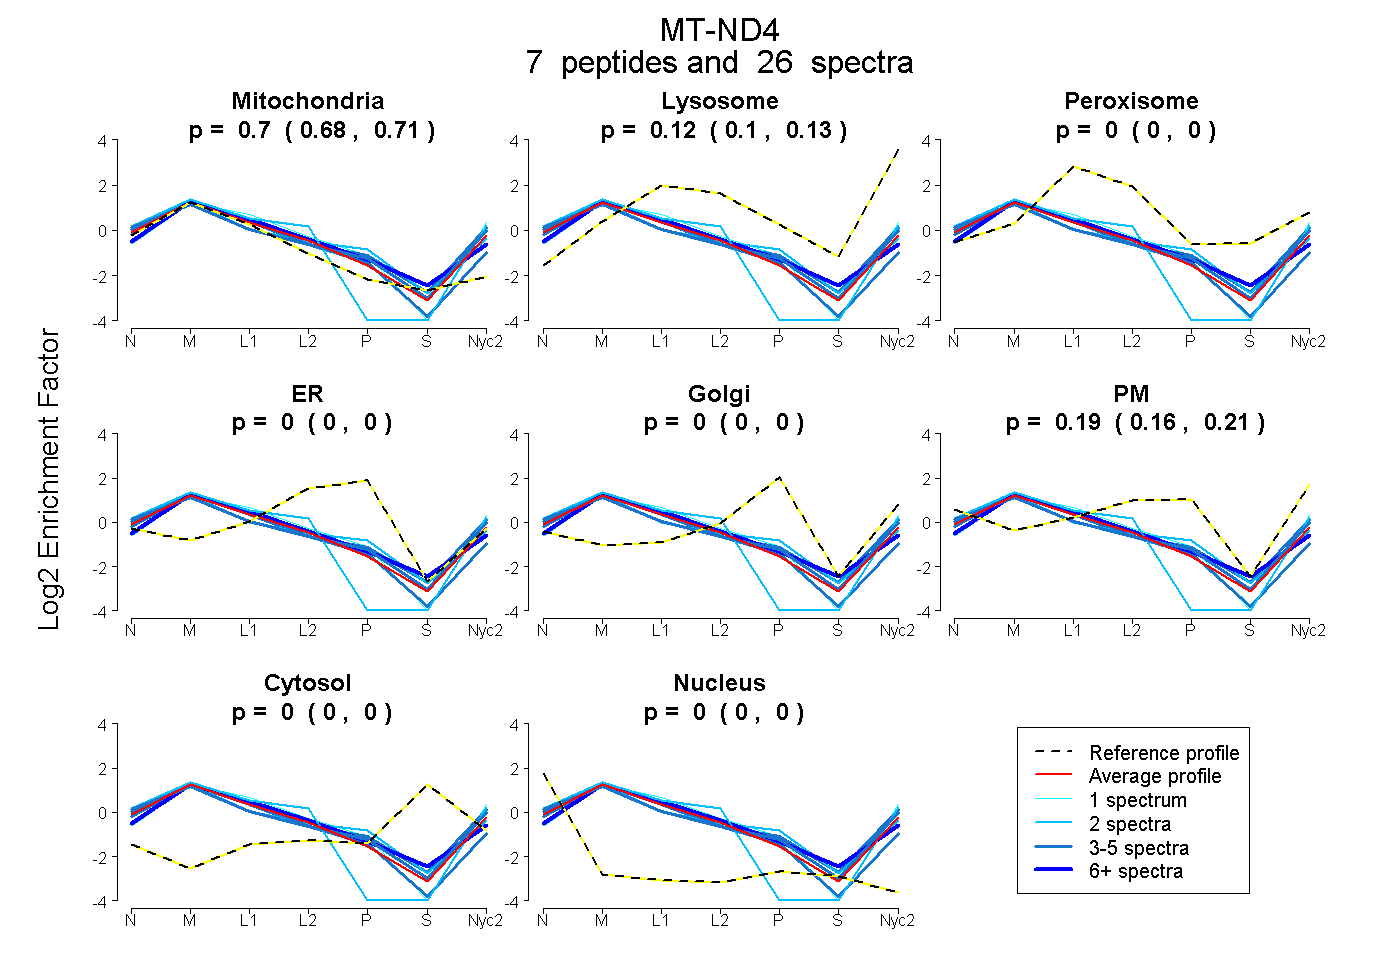
0.678 | 0.712
0.097 | 0.132
0.000 | 0.000
0.000 | 0.000
0.000 | 0.000
0.156 | 0.213
0.000 | 0.000
0.000 | 0.000
2peptides
spectra
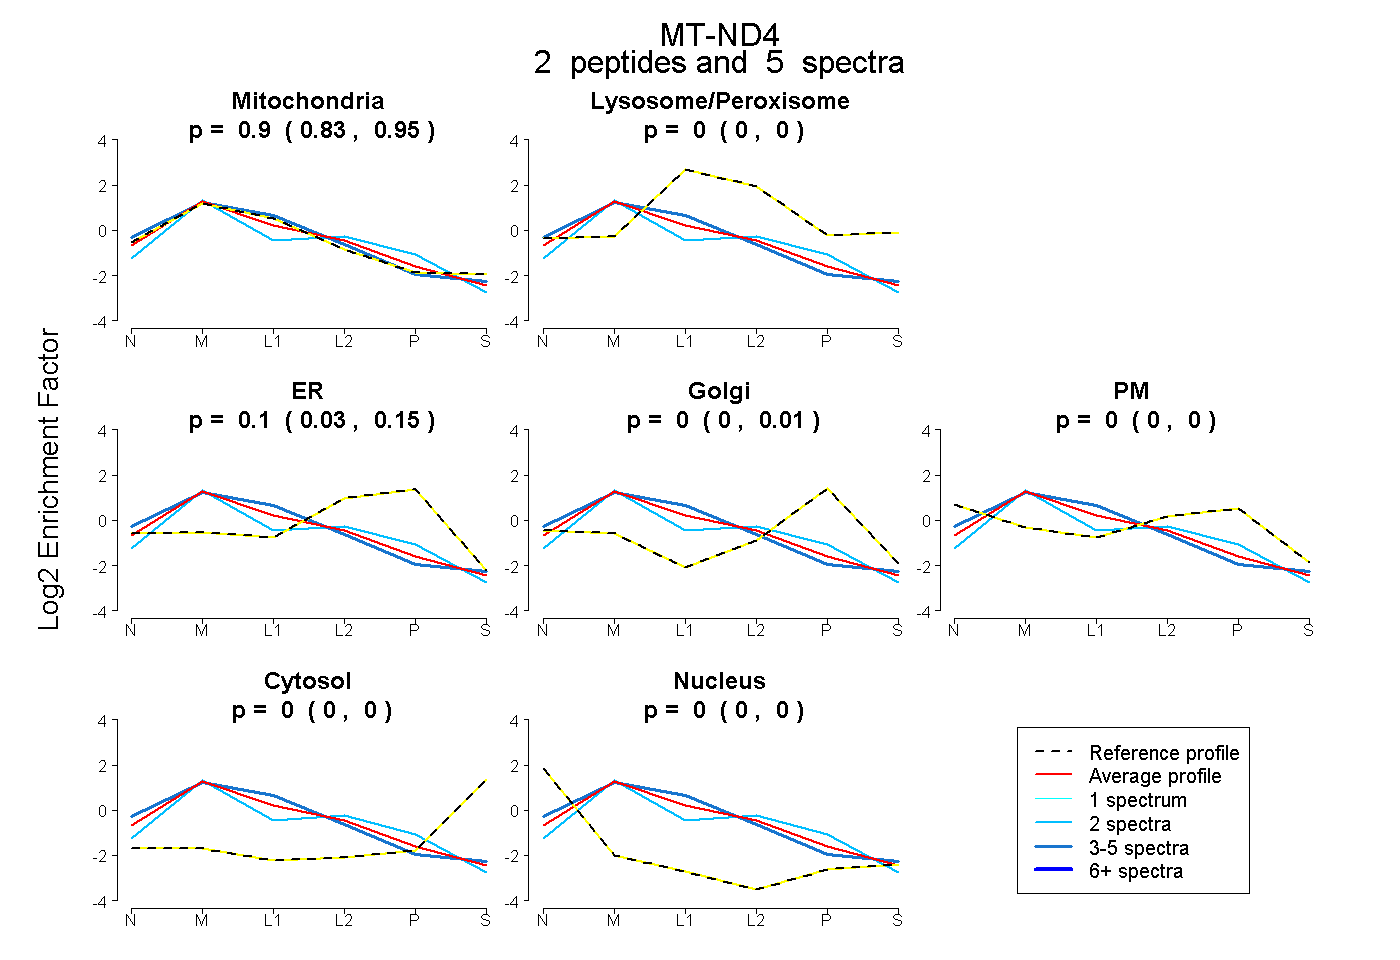
0.833 | 0.951
0.000 | 0.000
0.031 | 0.155
0.000 | 0.014
0.000 | 0.000
0.000 | 0.000
0.000 | 0.004
7peptides
spectra
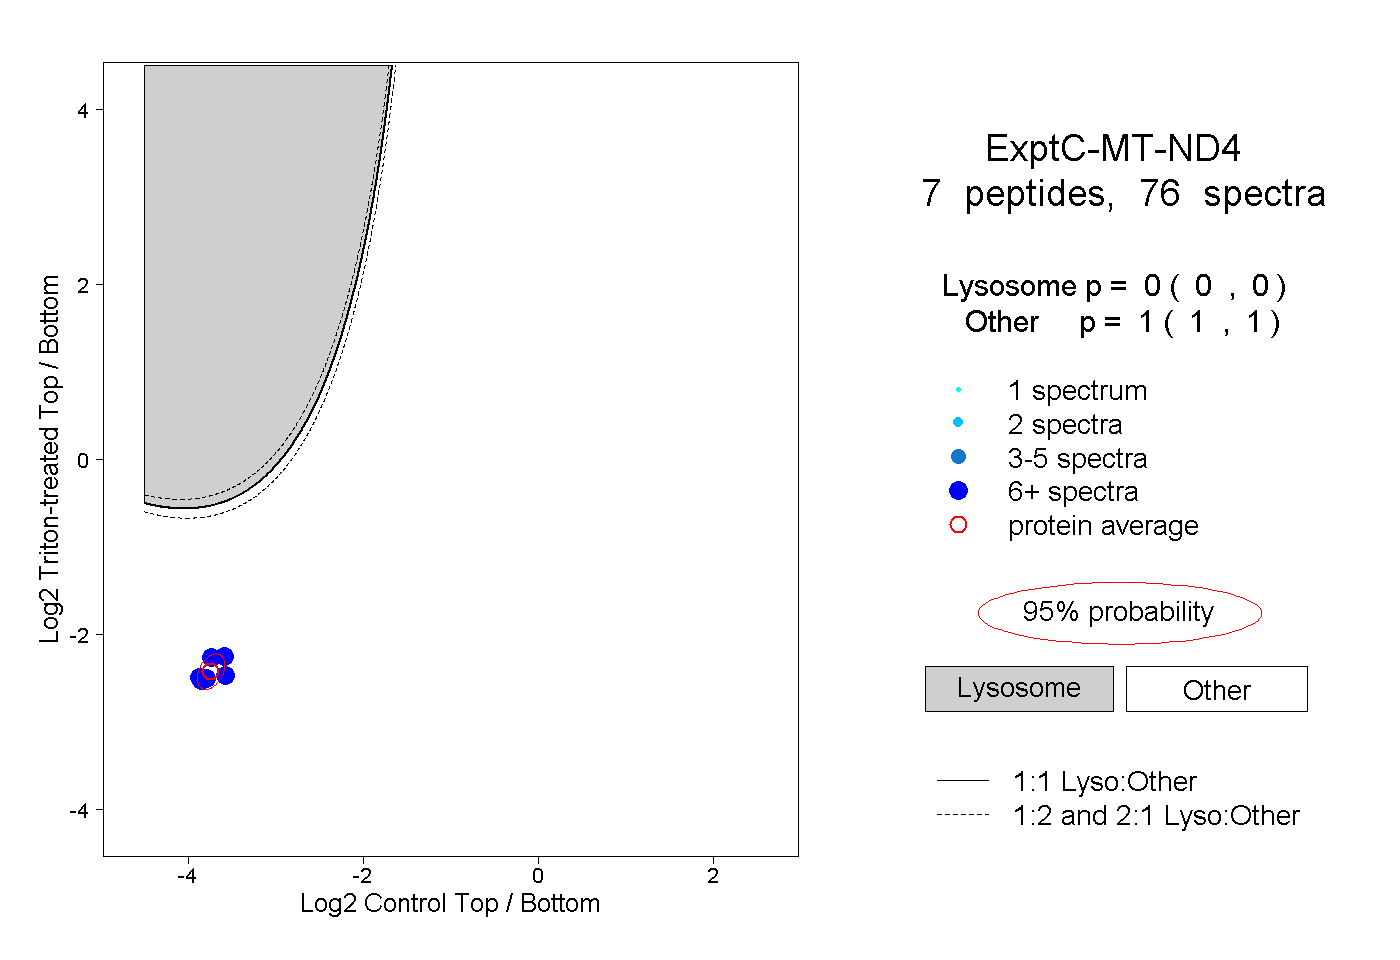
0.000 | 0.000
1.000 | 1.000
1peptide
spectra
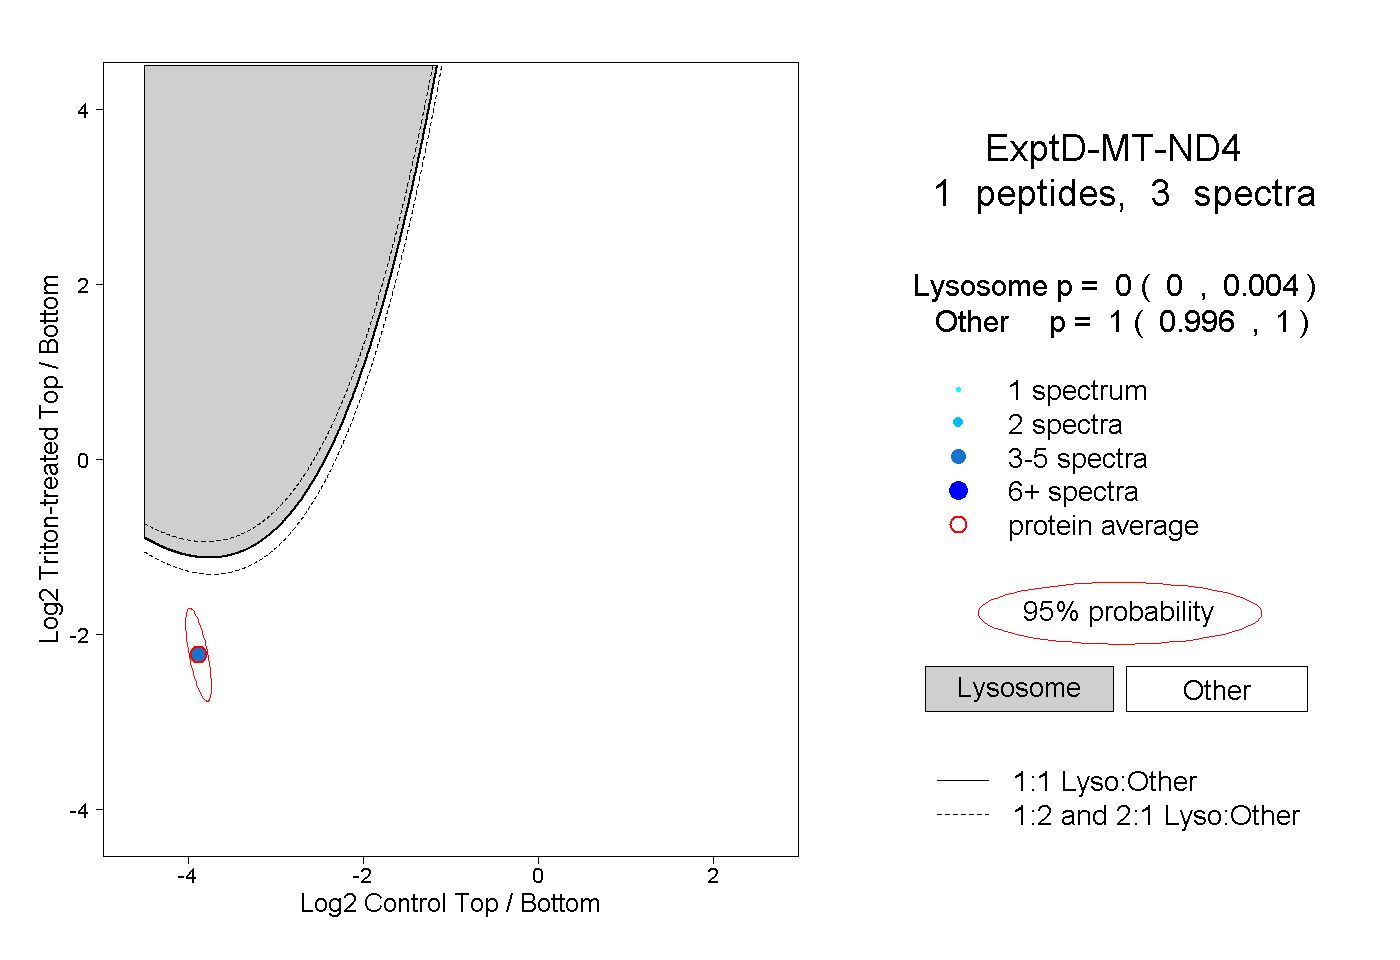
0.000 | 0.004
0.996 | 1.000