 7
7peptides
spectra
0.678 | 0.712
0.097 | 0.132
0.000 | 0.000
0.000 | 0.000
0.000 | 0.000
0.156 | 0.213
0.000 | 0.000
0.000 | 0.000
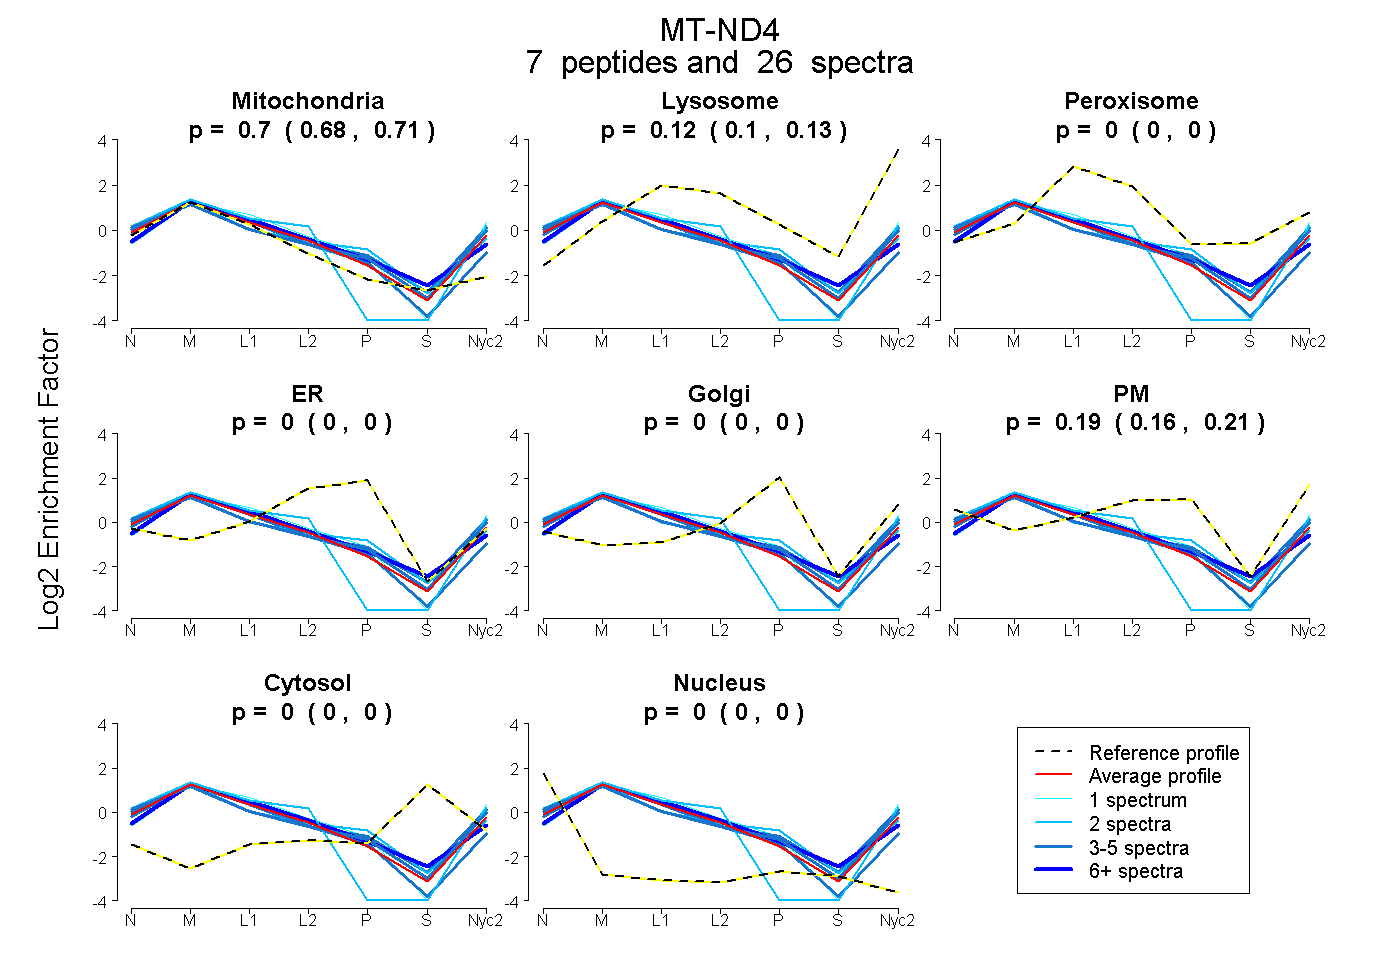
| Plot | Mito | Lyso | Perox | ER | Golgi | PM | Cytosol | Nucleus | |||||
| Expt A |
7 peptides |
26 spectra |
|
0.697 0.678 | 0.712 |
0.115 0.097 | 0.132 |
0.000 0.000 | 0.000 |
0.000 0.000 | 0.000 |
0.000 0.000 | 0.000 |
0.188 0.156 | 0.213 |
0.000 0.000 | 0.000 |
0.000 0.000 | 0.000 |
| 2 spectra, VSIILDPLTK | 0.828 | 0.172 | 0.000 | 0.000 | 0.000 | 0.000 | 0.000 | 0.000 | ||
| 8 spectra, TMIMAR | 0.726 | 0.200 | 0.000 | 0.000 | 0.025 | 0.048 | 0.000 | 0.000 | ||
| 3 spectra, LGGYGMMR | 0.625 | 0.158 | 0.000 | 0.000 | 0.000 | 0.217 | 0.000 | 0.000 | ||
| 2 spectra, LITGLTM | 0.642 | 0.147 | 0.000 | 0.000 | 0.197 | 0.014 | 0.000 | 0.000 | ||
| 1 spectrum, ENMMHQK | 0.571 | 0.070 | 0.000 | 0.000 | 0.000 | 0.359 | 0.000 | 0.000 | ||
| 5 spectra, WGNQTER | 0.630 | 0.034 | 0.000 | 0.000 | 0.000 | 0.335 | 0.000 | 0.000 | ||
| 5 spectra, MPLYGVHLWLPK | 0.772 | 0.000 | 0.000 | 0.000 | 0.000 | 0.228 | 0.000 | 0.000 |
| Plot | Mito | Lyso or Perox | ER | Golgi | PM | Cytosol | Nucleus | ||||||
| Expt B |
2 peptides |
5 spectra |
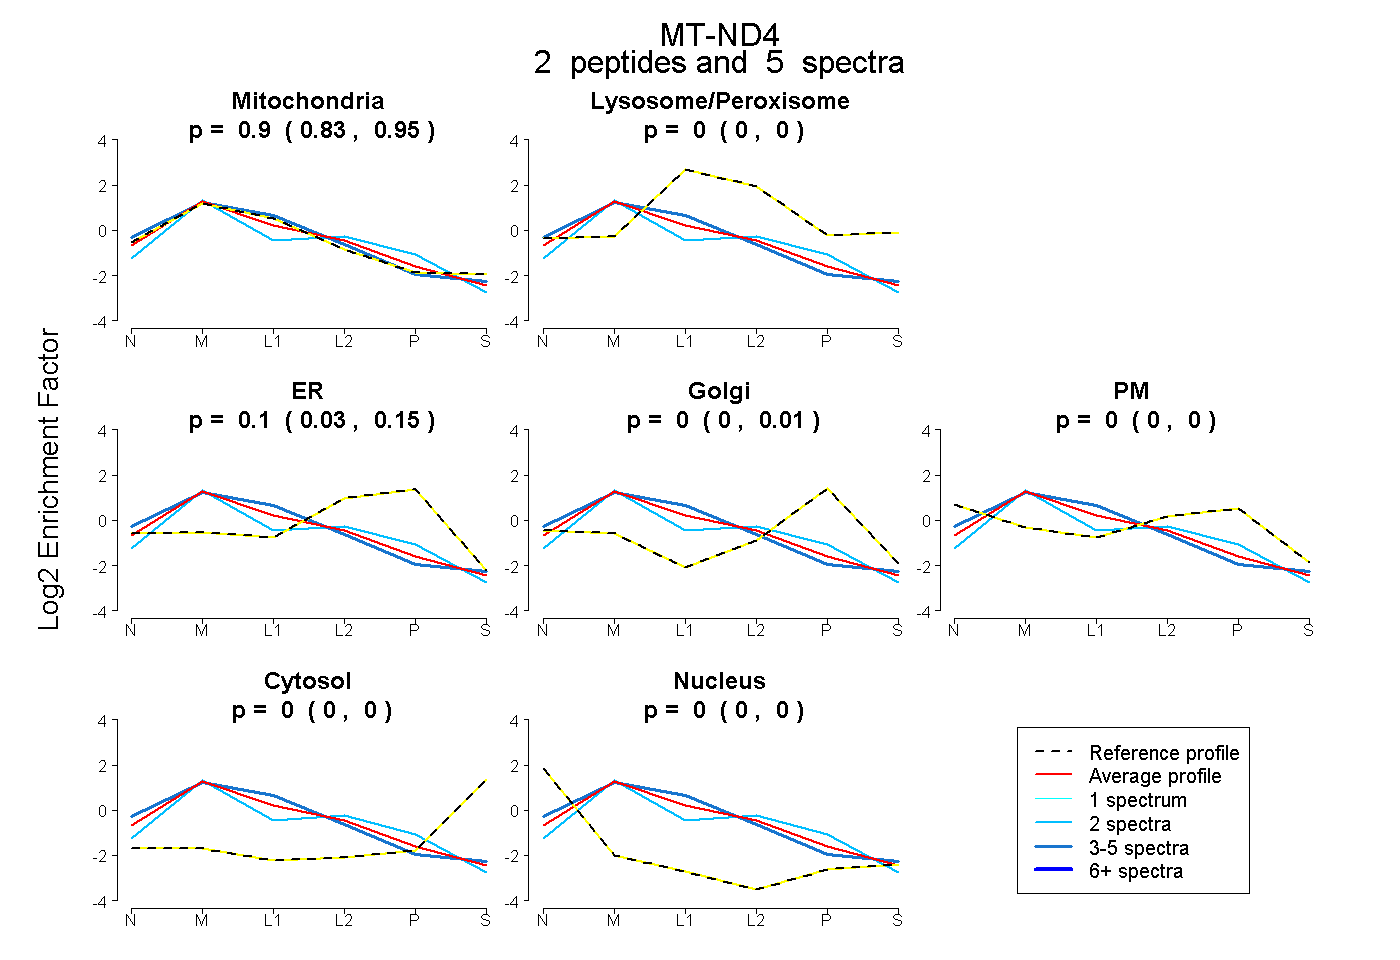 |
0.897 0.833 | 0.951 |
0.000 0.000 | 0.000 |
0.103 0.031 | 0.155 |
0.000 0.000 | 0.014 |
0.000 0.000 | 0.000 |
0.000 0.000 | 0.000 |
0.000 0.000 | 0.004 |
|||
| Plot | Lyso | Other | |||||||||||
| Expt C |
7 peptides |
76 spectra |
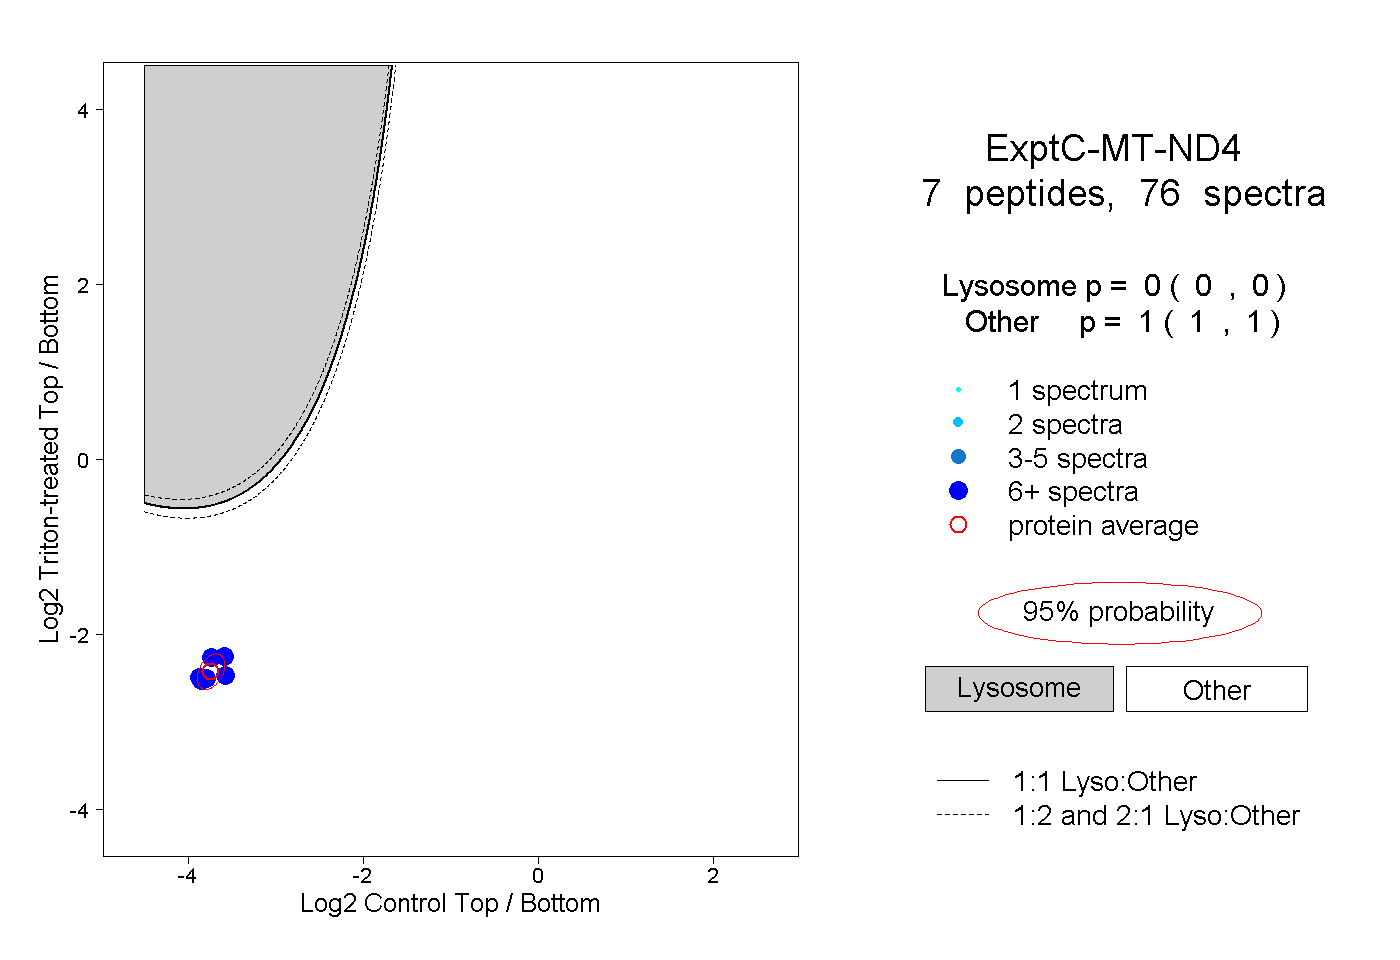 |
0.000 0.000 | 0.000 |
1.000 1.000 | 1.000 |
||||||||
| Plot | Lyso | Other | |||||||||||
| Expt D |
1 peptide |
3 spectra |
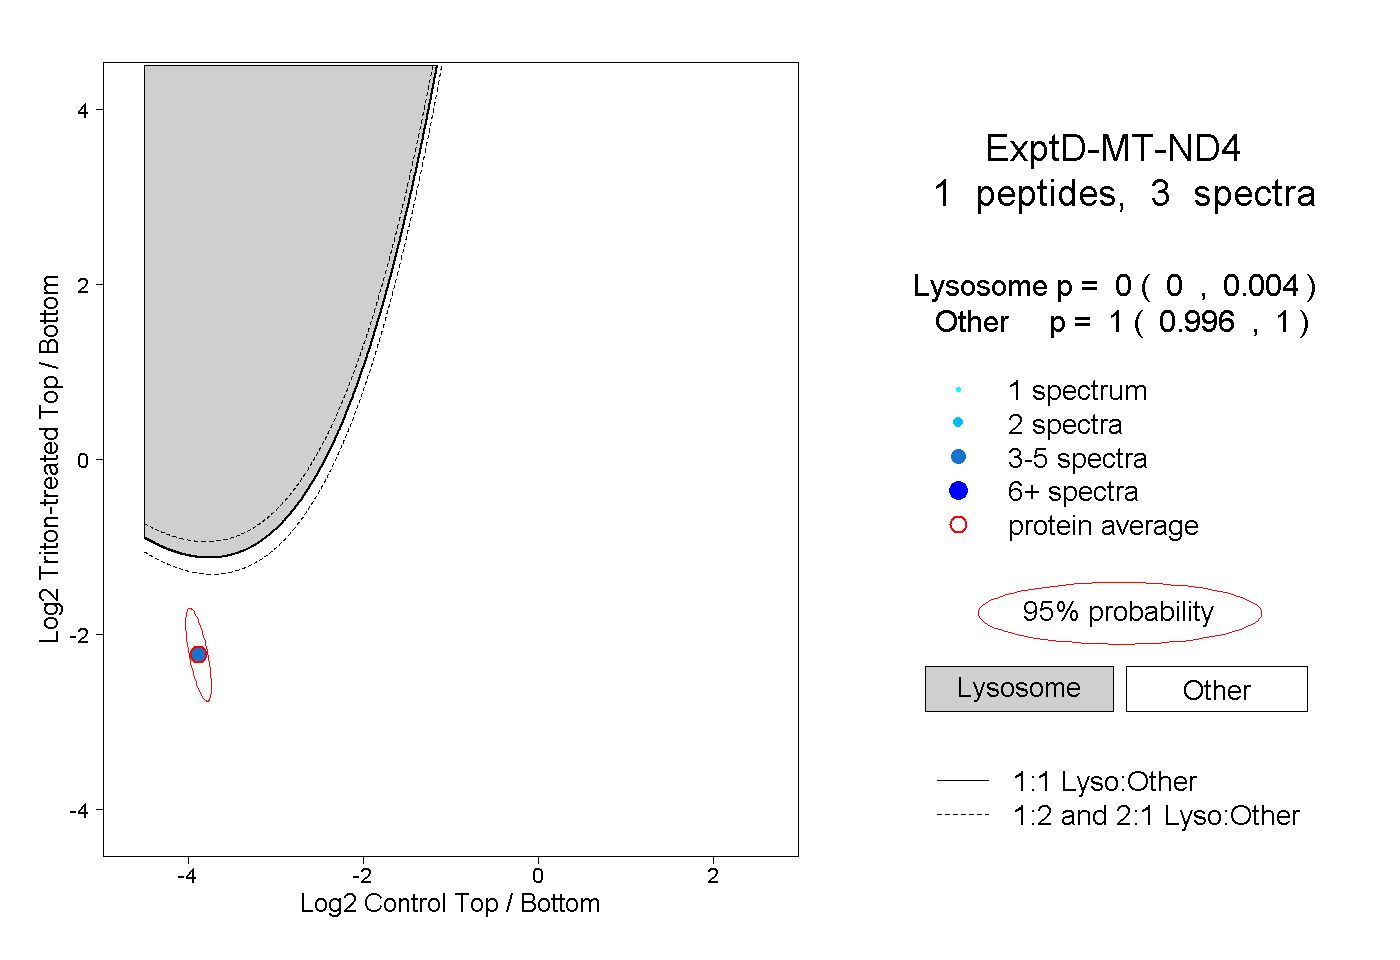 |
0.000 0.000 | 0.004 |
1.000 0.996 | 1.000 |