 6
6peptides
spectra
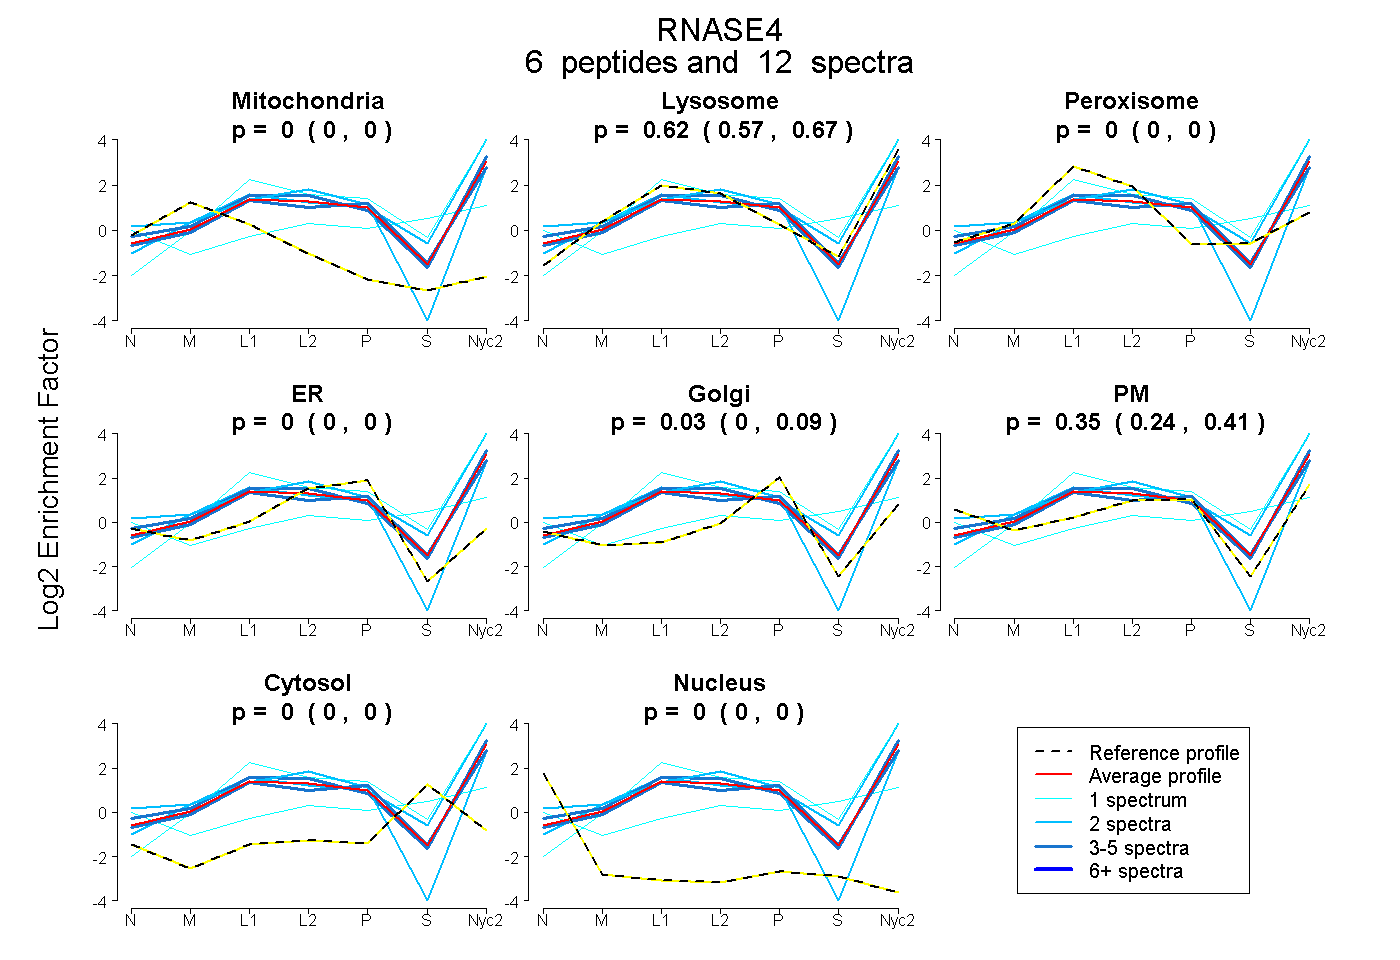
0.000 | 0.000
0.574 | 0.669
0.000 | 0.000
0.000 | 0.000
0.000 | 0.085
0.242 | 0.411
0.000 | 0.000
0.000 | 0.000
1peptide
spectrum
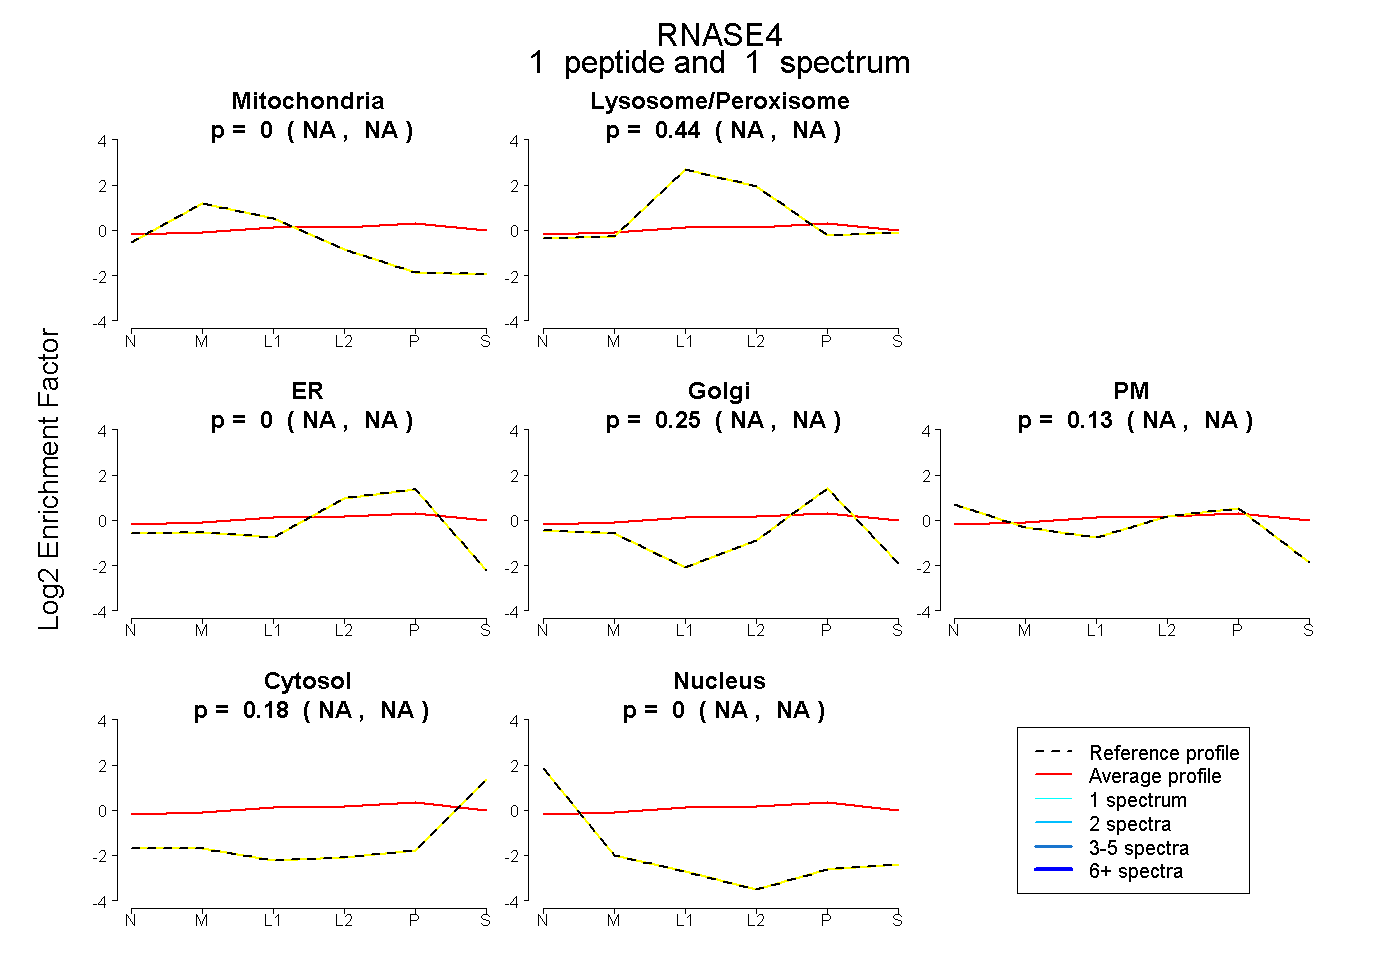
NA | NA
NA | NA
NA | NA
NA | NA
NA | NA
NA | NA
NA | NA
6peptides
spectra
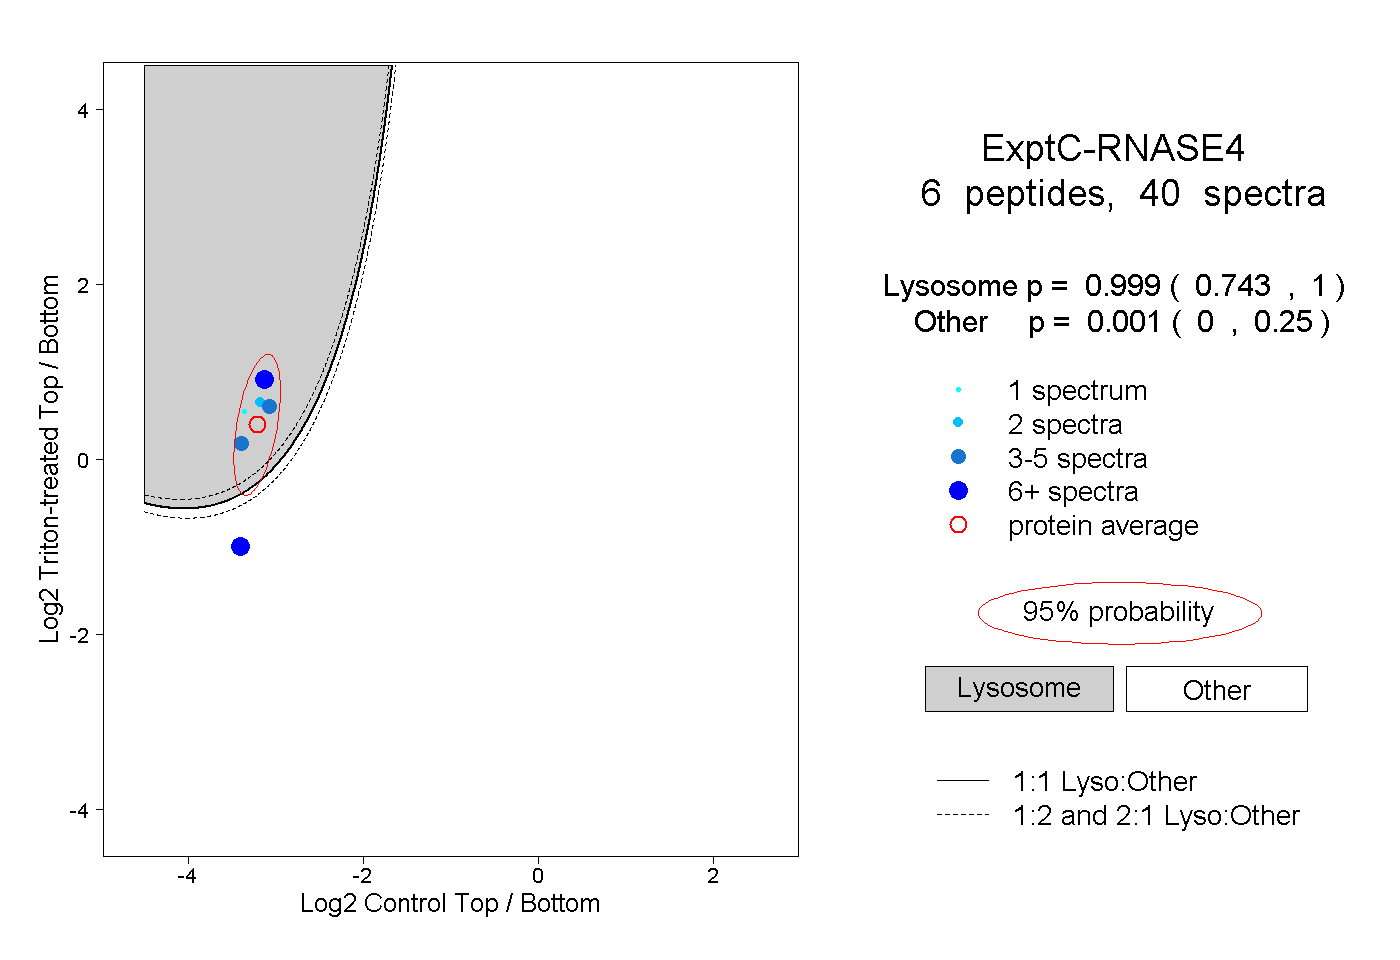
0.743 | 1.000
0.000 | 0.250
1peptide
spectra
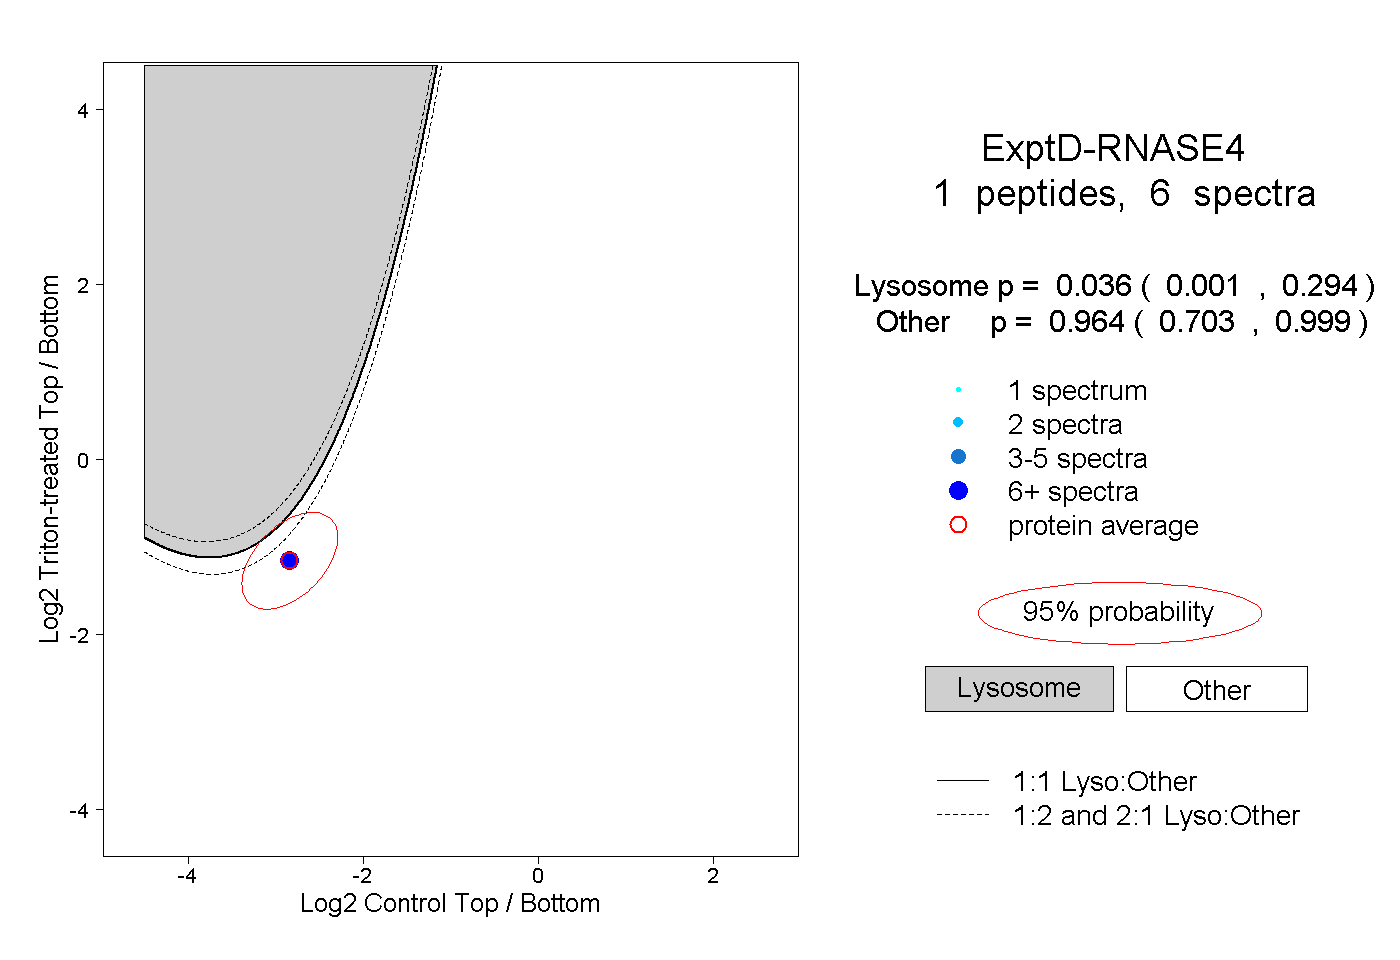
0.001 | 0.294
0.703 | 0.999