 6
6peptides
spectra
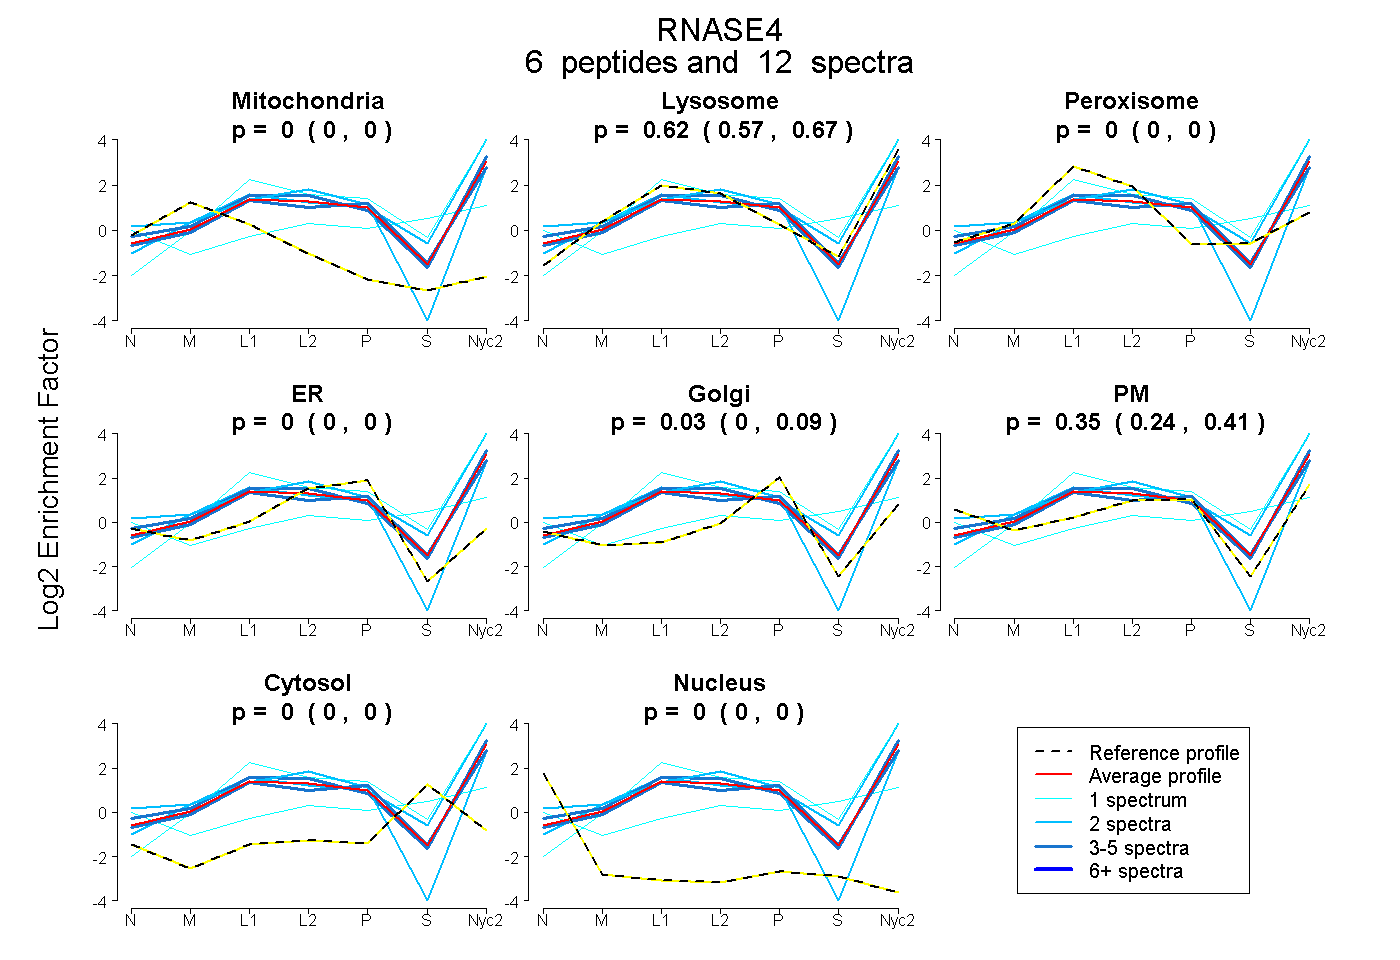
0.000 | 0.000
0.574 | 0.669
0.000 | 0.000
0.000 | 0.000
0.000 | 0.085
0.242 | 0.411
0.000 | 0.000
0.000 | 0.000
| Plot | Mito | Lyso | Perox | ER | Golgi | PM | Cytosol | Nucleus | |||||
| Expt A |
6 peptides |
12 spectra |
|
0.000 0.000 | 0.000 |
0.623 0.574 | 0.669 |
0.000 0.000 | 0.000 |
0.000 0.000 | 0.000 |
0.029 0.000 | 0.085 |
0.348 0.242 | 0.411 |
0.000 0.000 | 0.000 |
0.000 0.000 | 0.000 |
| 1 spectrum, ETGSSVPHNCR | 0.000 | 0.164 | 0.058 | 0.000 | 0.000 | 0.324 | 0.454 | 0.000 | ||
| 2 spectra, FNTFIHEDIWNIR | 0.000 | 0.931 | 0.000 | 0.000 | 0.069 | 0.000 | 0.000 | 0.000 | ||
| 2 spectra, QHVDPEGTGGSDNYCNVMMQR | 0.000 | 0.268 | 0.000 | 0.000 | 0.000 | 0.732 | 0.000 | 0.000 | ||
| 3 spectra, VVIACEGTPEVPVHFDR | 0.000 | 0.611 | 0.000 | 0.000 | 0.196 | 0.193 | 0.000 | 0.000 | ||
| 3 spectra, NGNMNCHEGIVR | 0.000 | 0.626 | 0.000 | 0.000 | 0.000 | 0.374 | 0.000 | 0.000 | ||
| 1 spectrum, MTSTQCK | 0.000 | 1.000 | 0.000 | 0.000 | 0.000 | 0.000 | 0.000 | 0.000 |
| Plot | Mito | Lyso or Perox | ER | Golgi | PM | Cytosol | Nucleus | ||||||
| Expt B |
1 peptide |
1 spectrum |
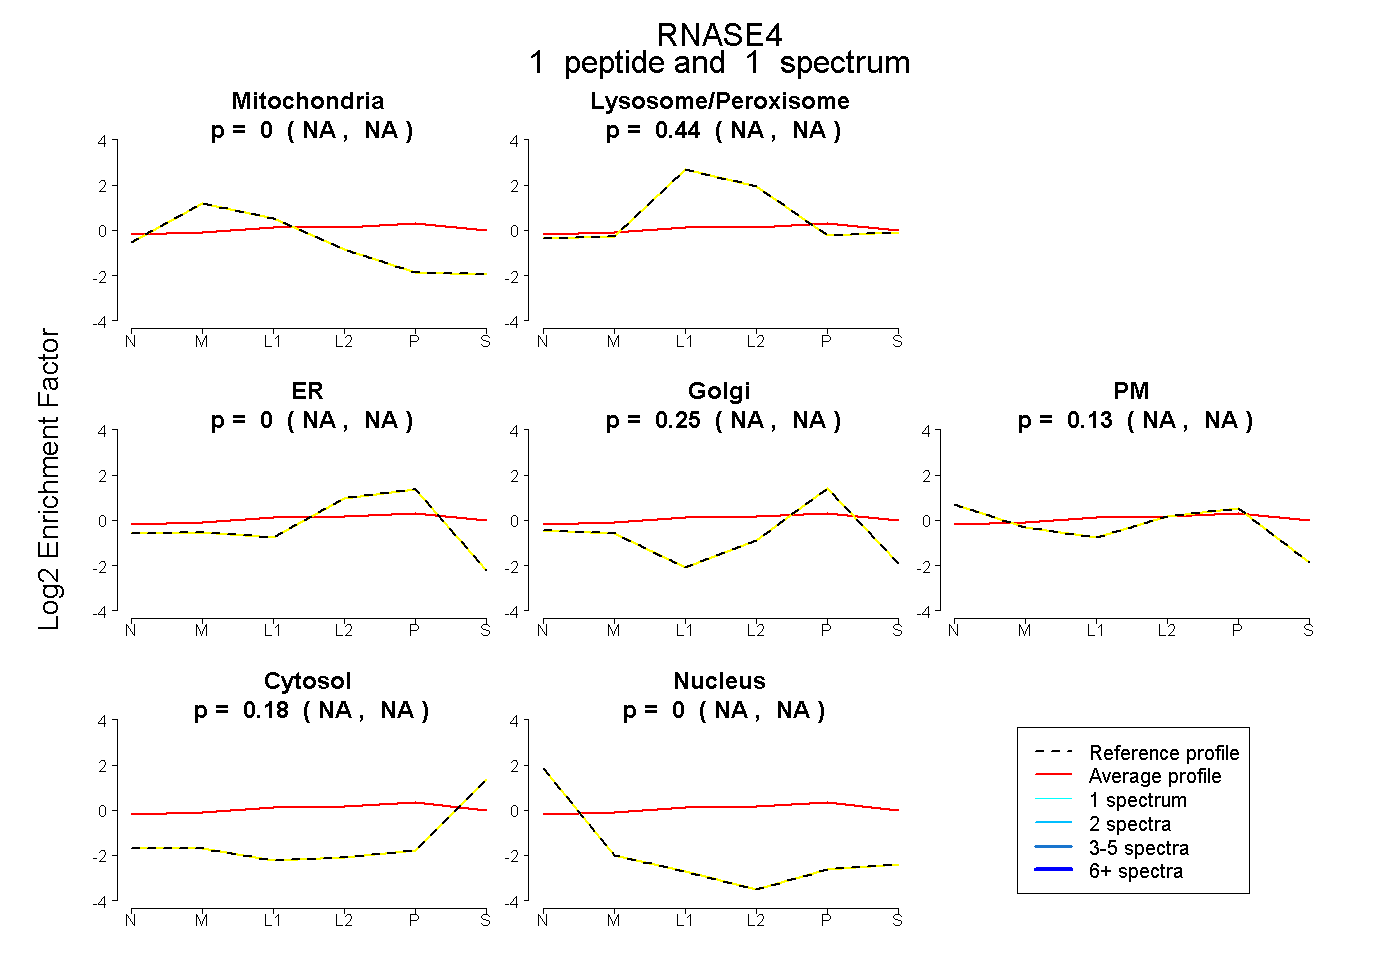 |
0.000 NA | NA |
0.442 NA | NA |
0.000 NA | NA |
0.252 NA | NA |
0.130 NA | NA |
0.176 NA | NA |
0.000 NA | NA |
|||
| Plot | Lyso | Other | |||||||||||
| Expt C |
6 peptides |
40 spectra |
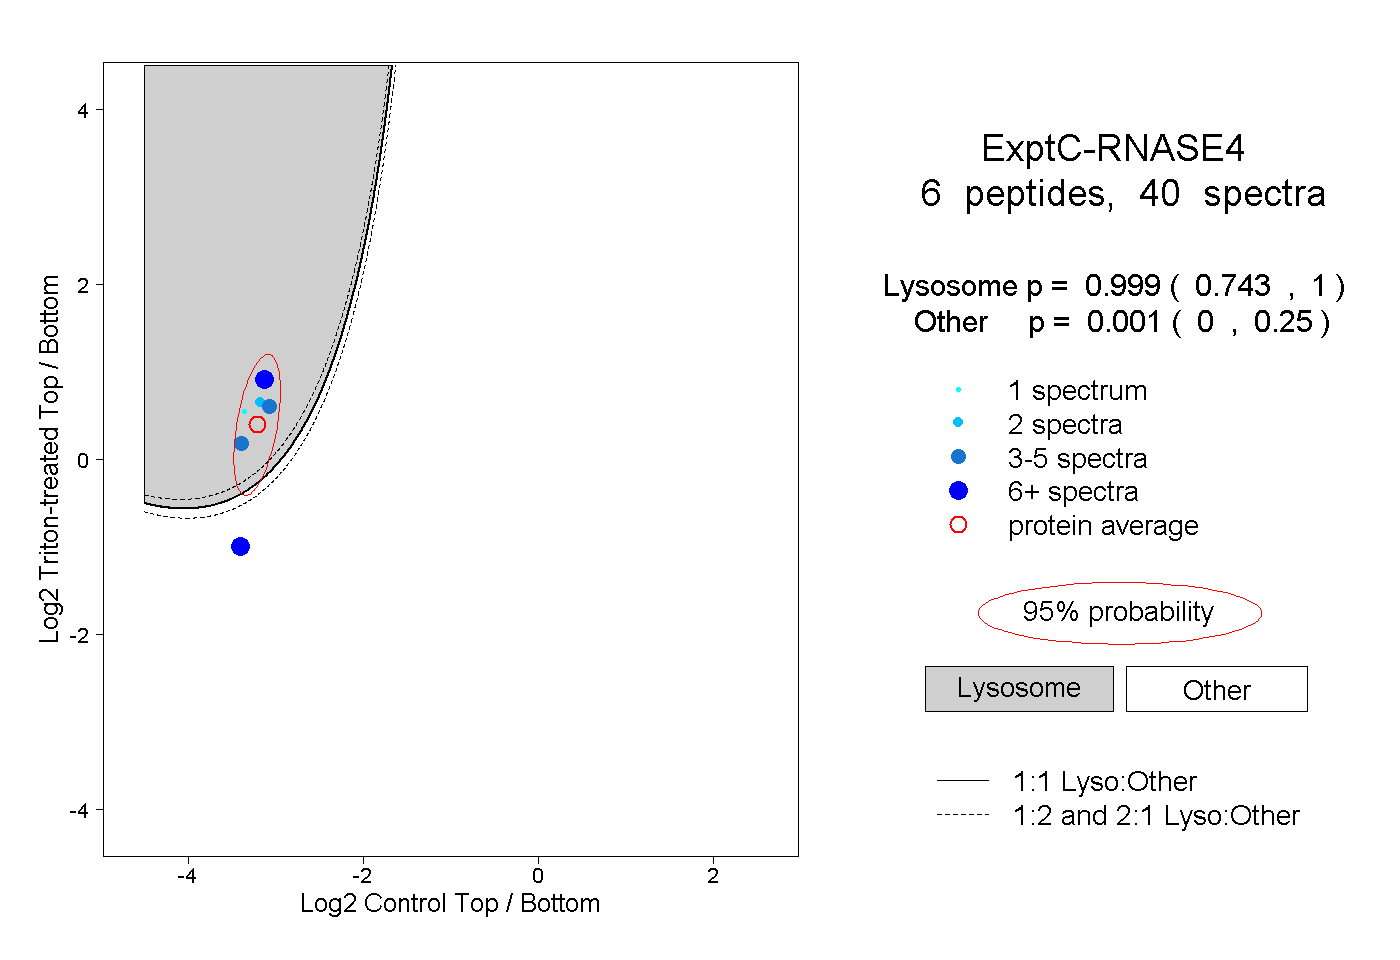 |
0.999 0.743 | 1.000 |
0.001 0.000 | 0.250 |
||||||||
| Plot | Lyso | Other | |||||||||||
| Expt D |
1 peptide |
6 spectra |
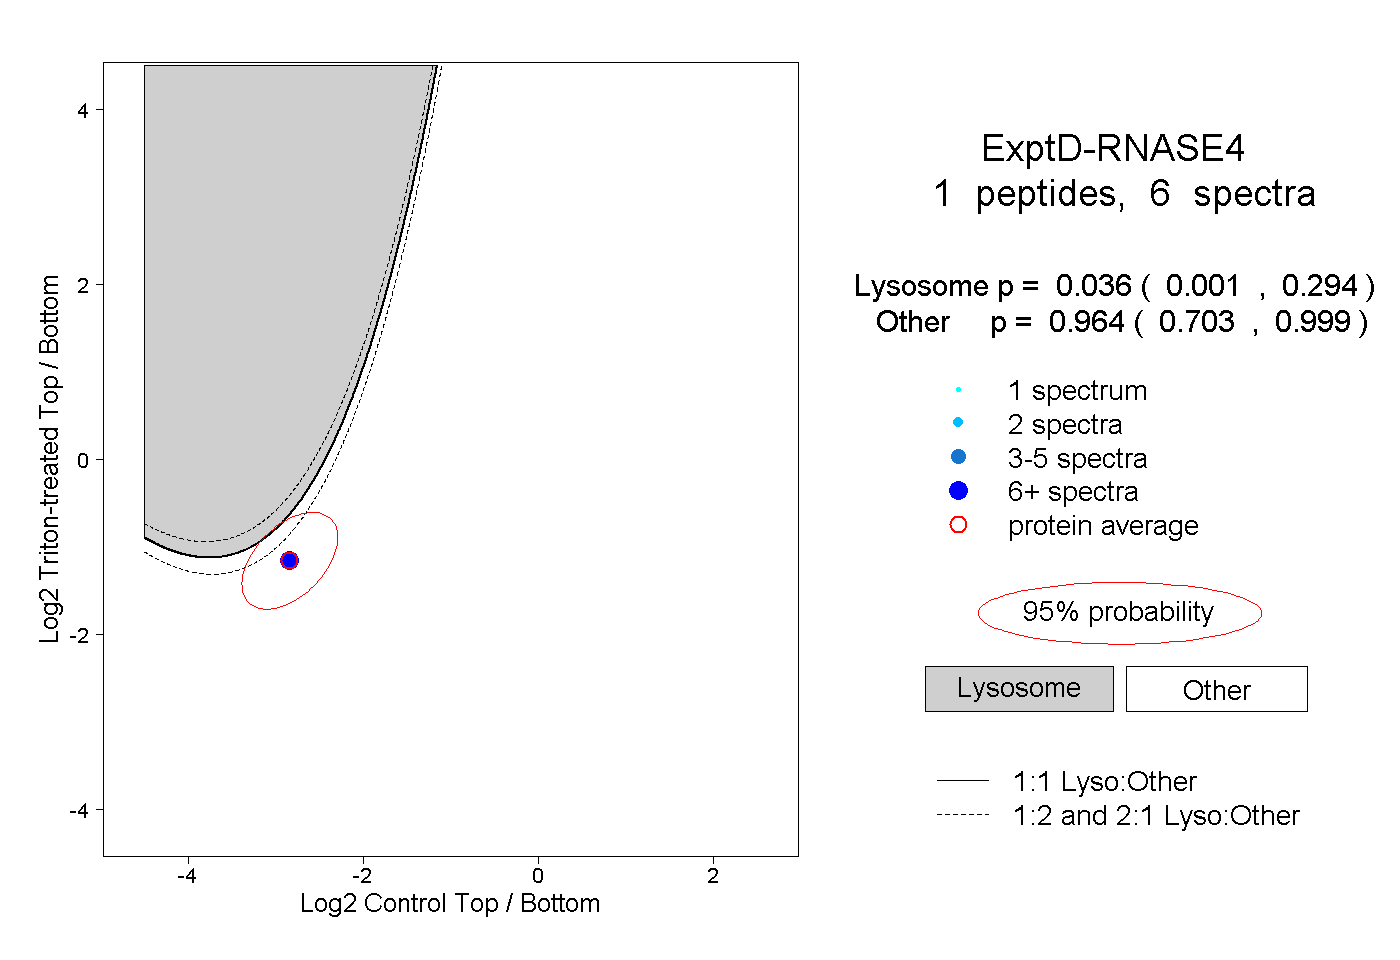 |
0.036 0.001 | 0.294 |
0.964 0.703 | 0.999 |