 12
12peptides
spectra
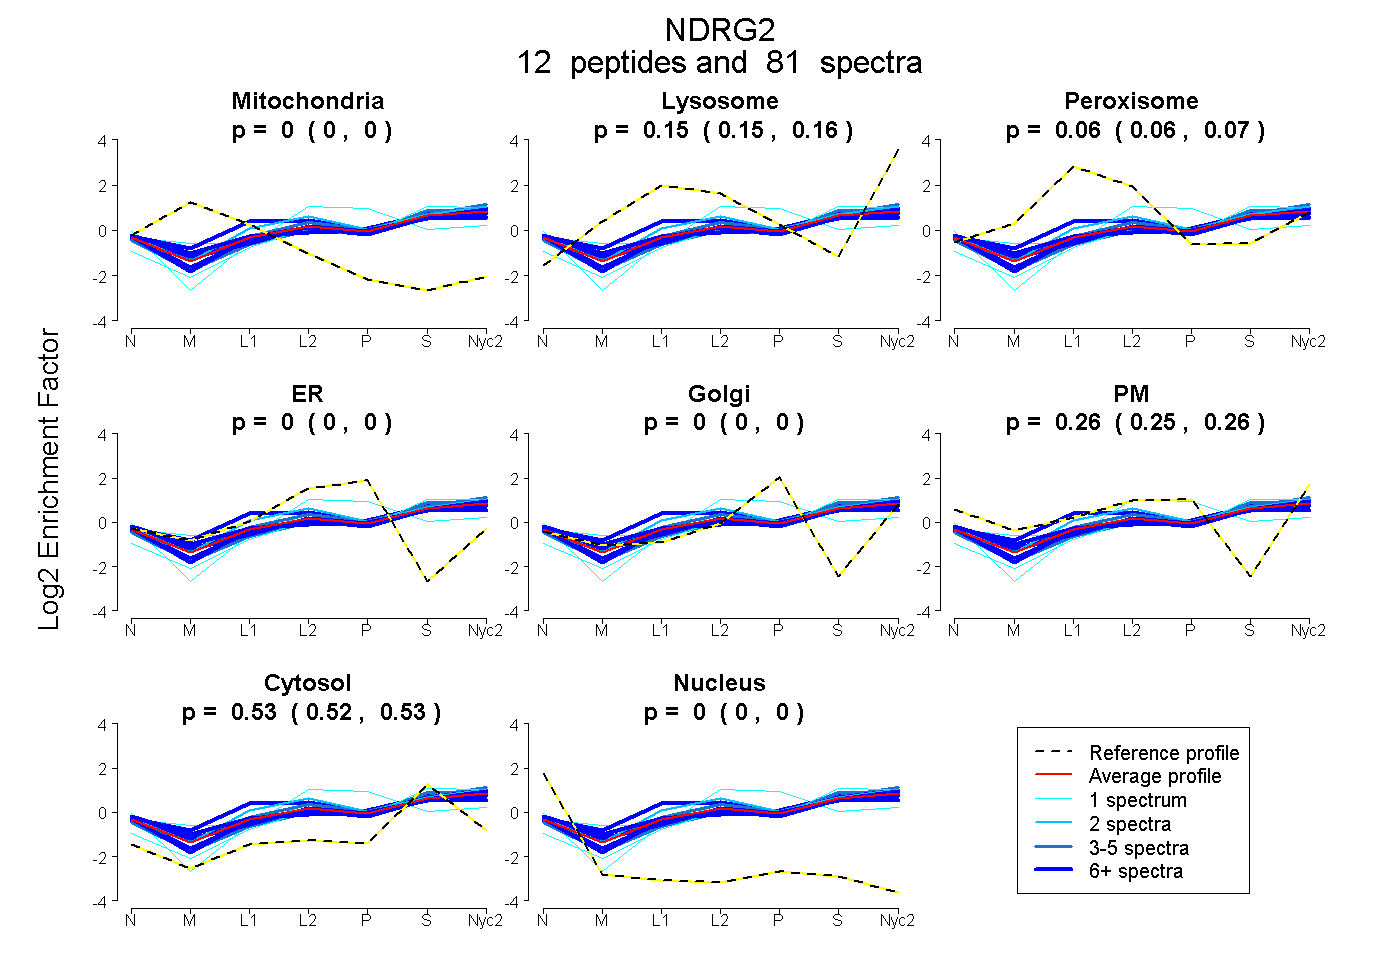
0.000 | 0.000
0.147 | 0.155
0.057 | 0.069
0.000 | 0.000
0.000 | 0.000
0.253 | 0.260
0.524 | 0.530
0.000 | 0.000
9peptides
spectra
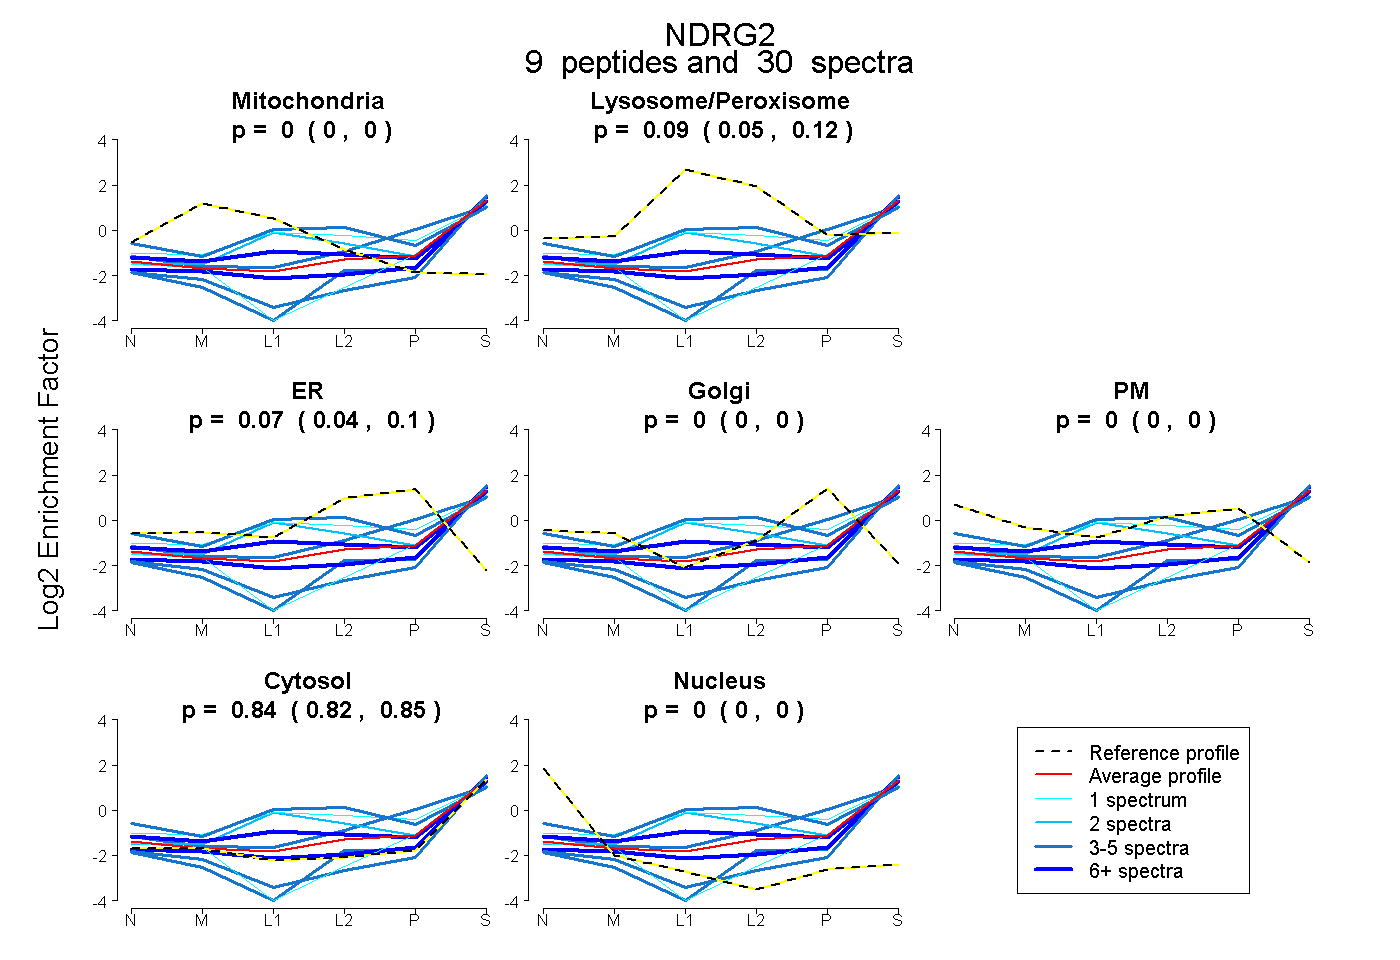
0.000 | 0.000
0.053 | 0.120
0.039 | 0.096
0.000 | 0.004
0.000 | 0.000
0.821 | 0.852
0.000 | 0.000
12peptides
spectra
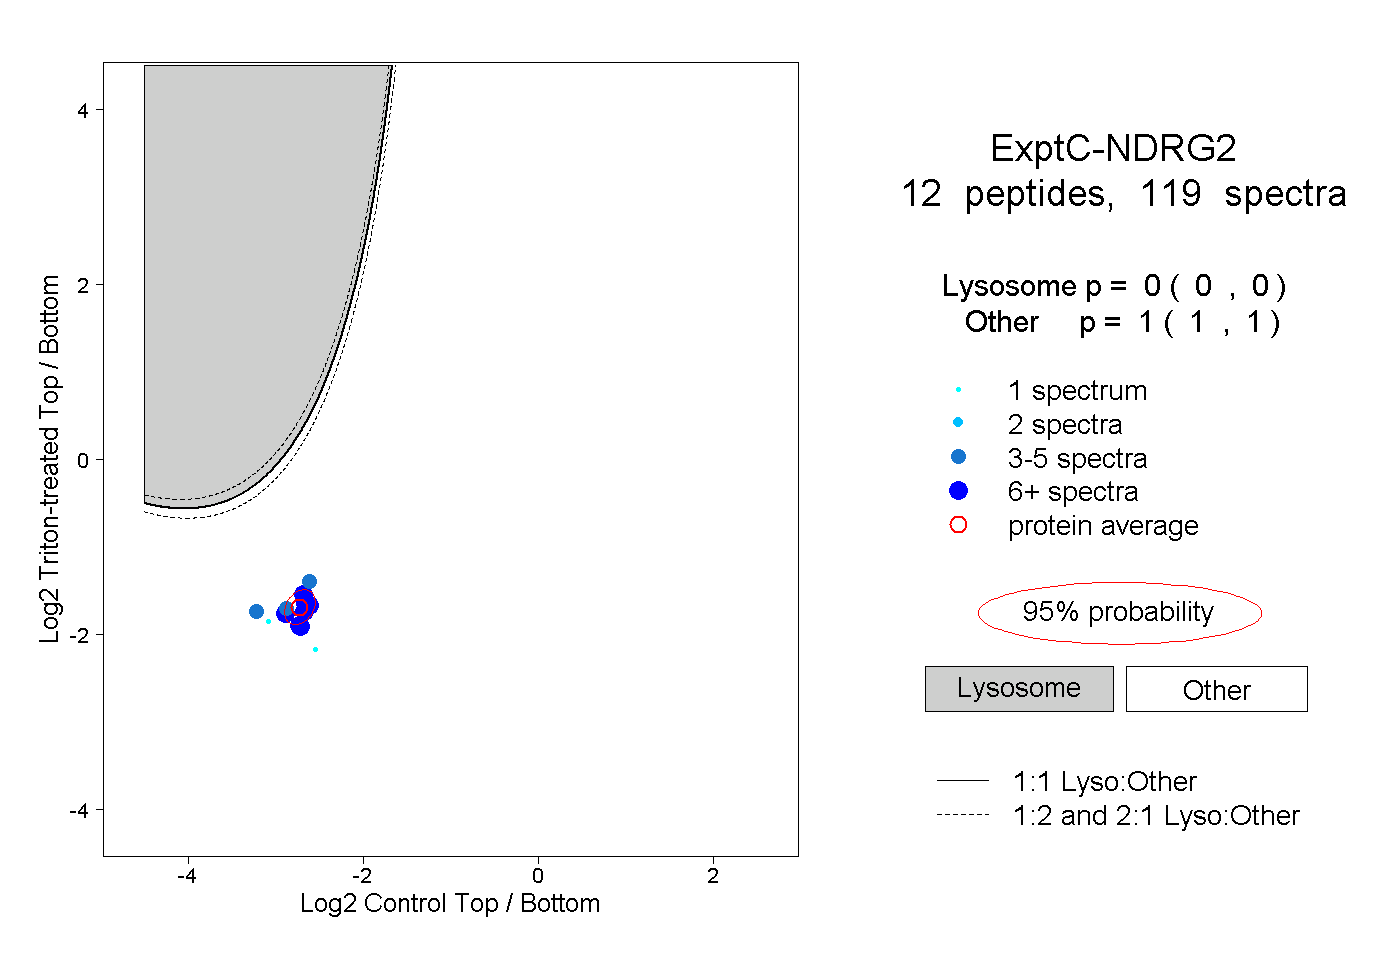
0.000 | 0.000
1.000 | 1.000
5peptides
spectra
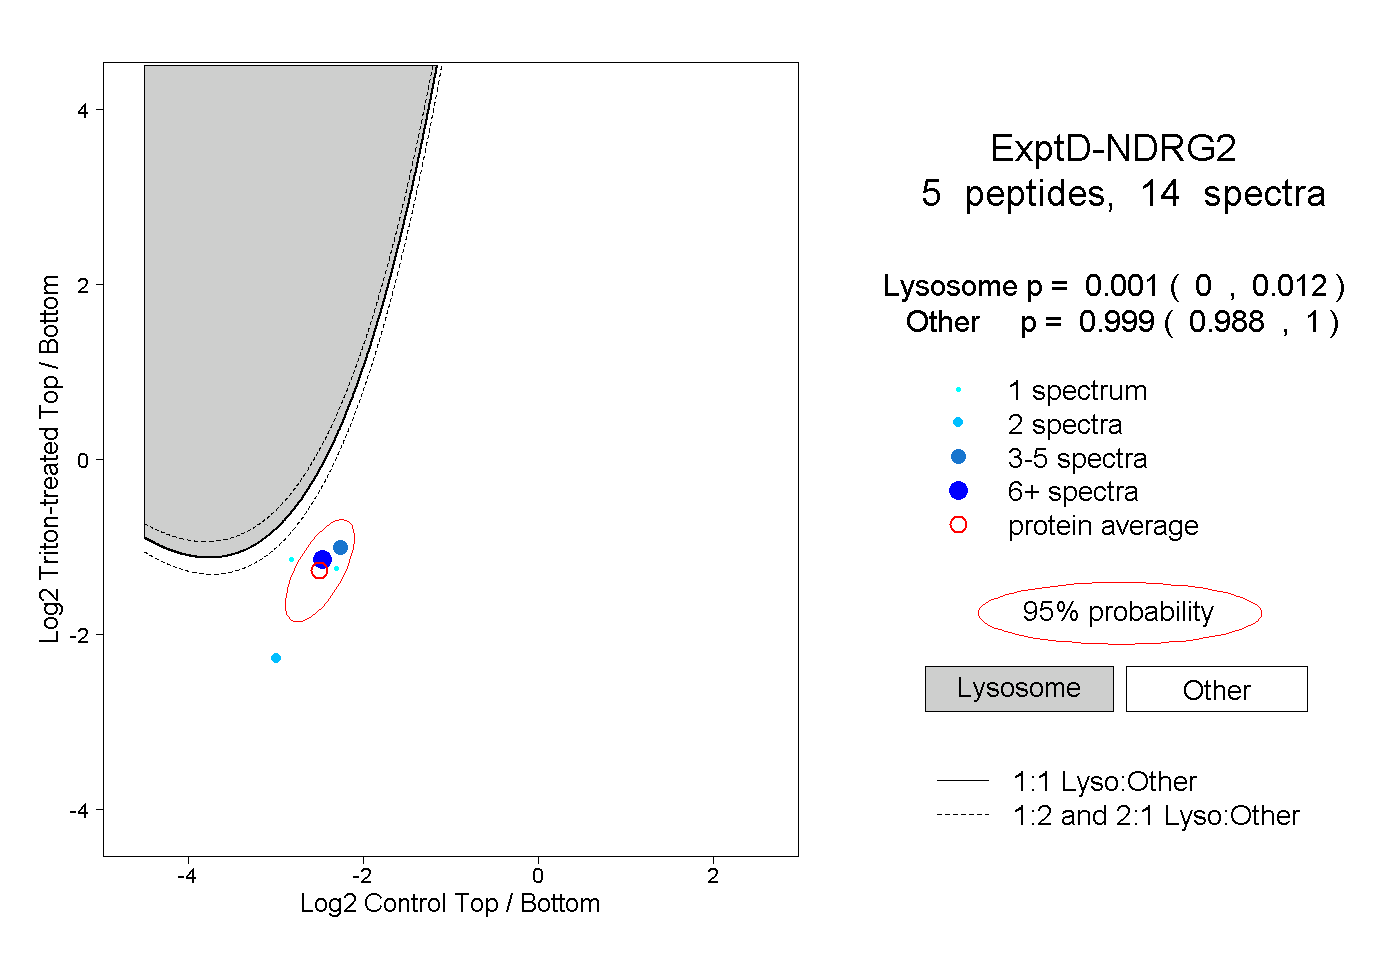
0.000 | 0.012
0.988 | 1.000