 12
12peptides
spectra
0.000 | 0.000
0.147 | 0.155
0.057 | 0.069
0.000 | 0.000
0.000 | 0.000
0.253 | 0.260
0.524 | 0.530
0.000 | 0.000
| Plot | Mito | Lyso | Perox | ER | Golgi | PM | Cytosol | Nucleus | |||||
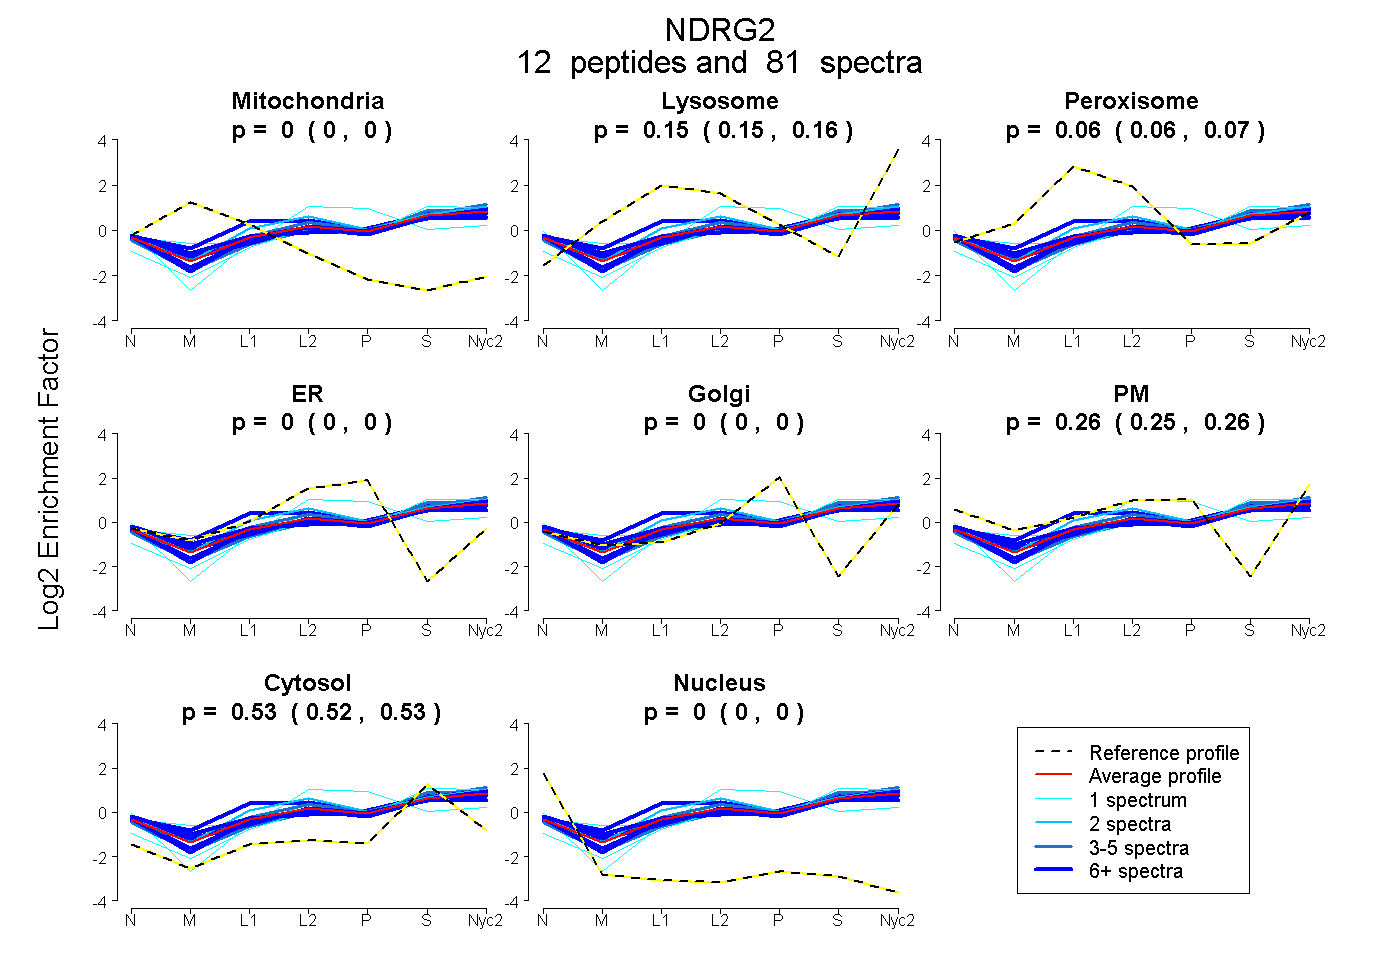
| Expt A |
12 peptides |
81 spectra |
|
0.000 0.000 | 0.000 |
0.152 0.147 | 0.155 |
0.064 0.057 | 0.069 |
0.000 0.000 | 0.000 |
0.000 0.000 | 0.000 |
0.257 0.253 | 0.260 |
0.527 0.524 | 0.530 |
0.000 0.000 | 0.000 |
| 5 spectra, GWMDWAAHK | 0.000 | 0.269 | 0.013 | 0.000 | 0.000 | 0.212 | 0.506 | 0.000 | ||
| 9 spectra, YFVQGMGYMASSCMTR | 0.000 | 0.054 | 0.127 | 0.000 | 0.000 | 0.309 | 0.510 | 0.000 | ||
| 2 spectra, RPAIFTYHDVGLNYK | 0.000 | 0.185 | 0.143 | 0.000 | 0.000 | 0.213 | 0.459 | 0.000 | ||
| 14 spectra, EAELAAR | 0.000 | 0.109 | 0.280 | 0.000 | 0.000 | 0.208 | 0.404 | 0.000 | ||
| 1 spectrum, AEELAAR | 0.000 | 0.089 | 0.061 | 0.382 | 0.000 | 0.121 | 0.348 | 0.000 | ||
| 8 spectra, LTEAFK | 0.000 | 0.192 | 0.000 | 0.000 | 0.000 | 0.282 | 0.526 | 0.000 | ||
| 9 spectra, GGEMTLK | 0.000 | 0.128 | 0.012 | 0.000 | 0.000 | 0.294 | 0.566 | 0.000 | ||
| 1 spectrum, MADSGGQPQLTQPGK | 0.000 | 0.263 | 0.000 | 0.000 | 0.004 | 0.076 | 0.657 | 0.000 | ||
| 1 spectrum, CPVMLVVGDQAPHEDAVVECNSK | 0.000 | 0.082 | 0.010 | 0.000 | 0.000 | 0.291 | 0.618 | 0.000 | ||
| 14 spectra, DLNFER | 0.000 | 0.179 | 0.032 | 0.000 | 0.000 | 0.225 | 0.564 | 0.000 | ||
| 14 spectra, TASLTSAASIDGSR | 0.000 | 0.163 | 0.020 | 0.000 | 0.000 | 0.263 | 0.554 | 0.000 | ||
| 3 spectra, LDPTQTSFLK | 0.000 | 0.174 | 0.000 | 0.000 | 0.000 | 0.212 | 0.614 | 0.000 |
| Plot | Mito | Lyso or Perox | ER | Golgi | PM | Cytosol | Nucleus | ||||||
| Expt B |
9 peptides |
30 spectra |
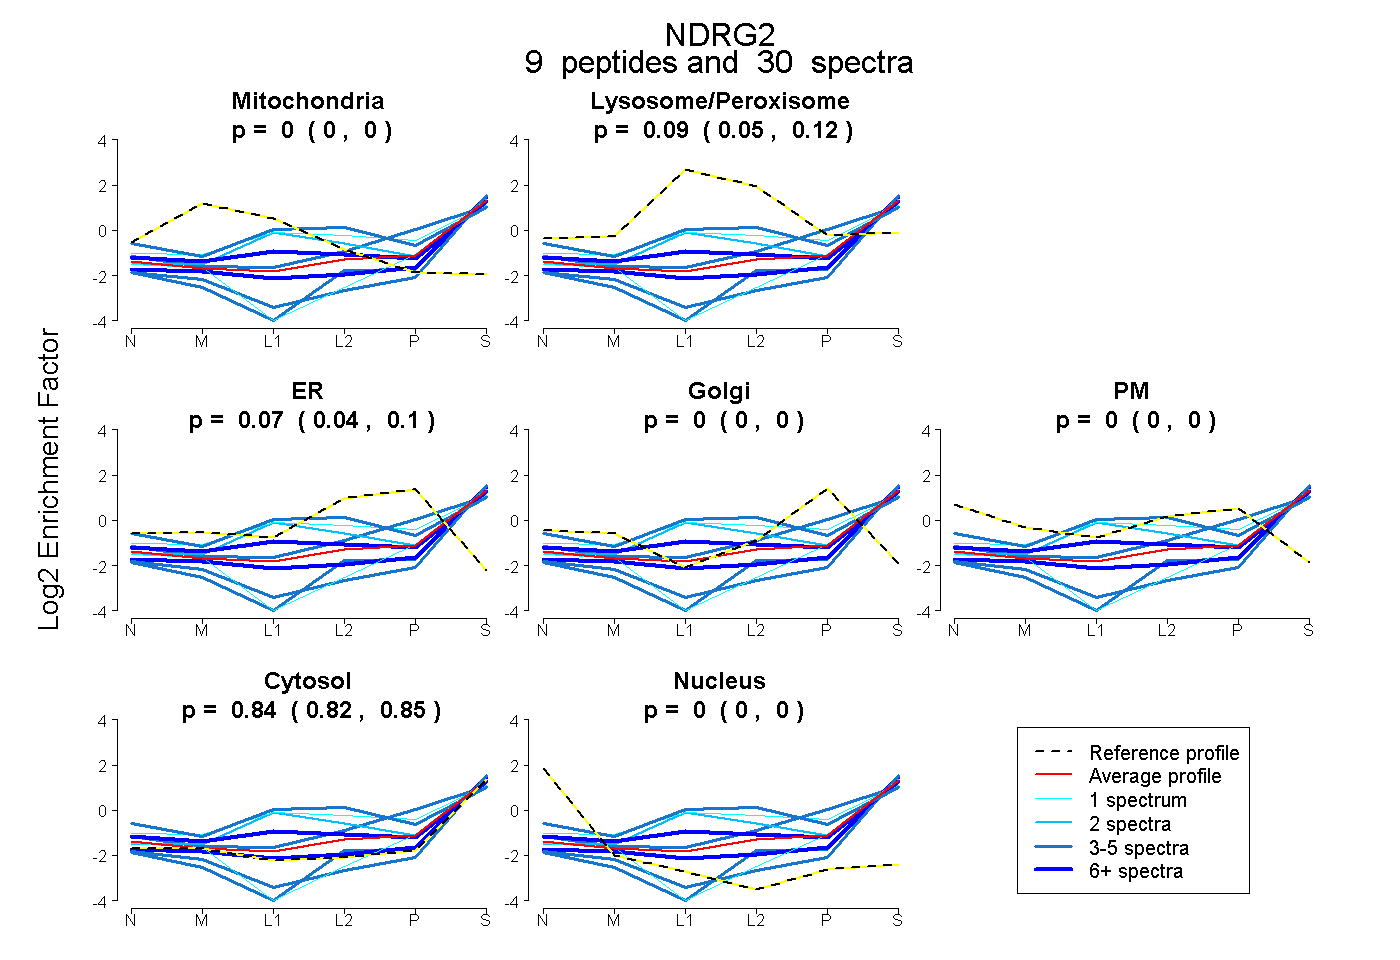 |
0.000 0.000 | 0.000 |
0.089 0.053 | 0.120 |
0.074 0.039 | 0.096 |
0.000 0.000 | 0.004 |
0.000 0.000 | 0.000 |
0.837 0.821 | 0.852 |
0.000 0.000 | 0.000 |
|||
| Plot | Lyso | Other | |||||||||||
| Expt C |
12 peptides |
119 spectra |
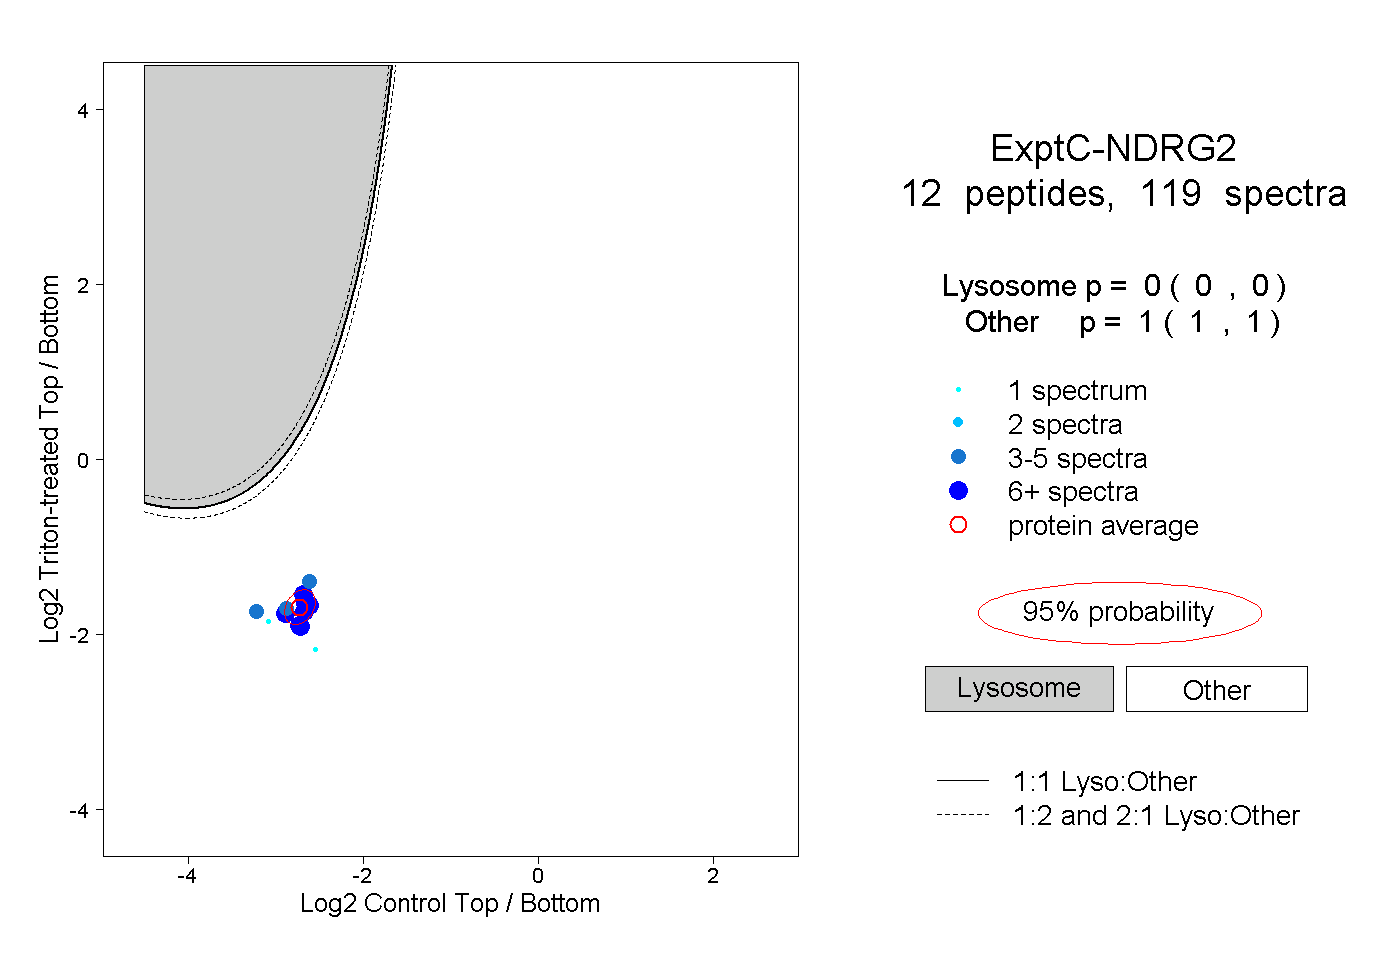 |
0.000 0.000 | 0.000 |
1.000 1.000 | 1.000 |
||||||||
| Plot | Lyso | Other | |||||||||||
| Expt D |
5 peptides |
14 spectra |
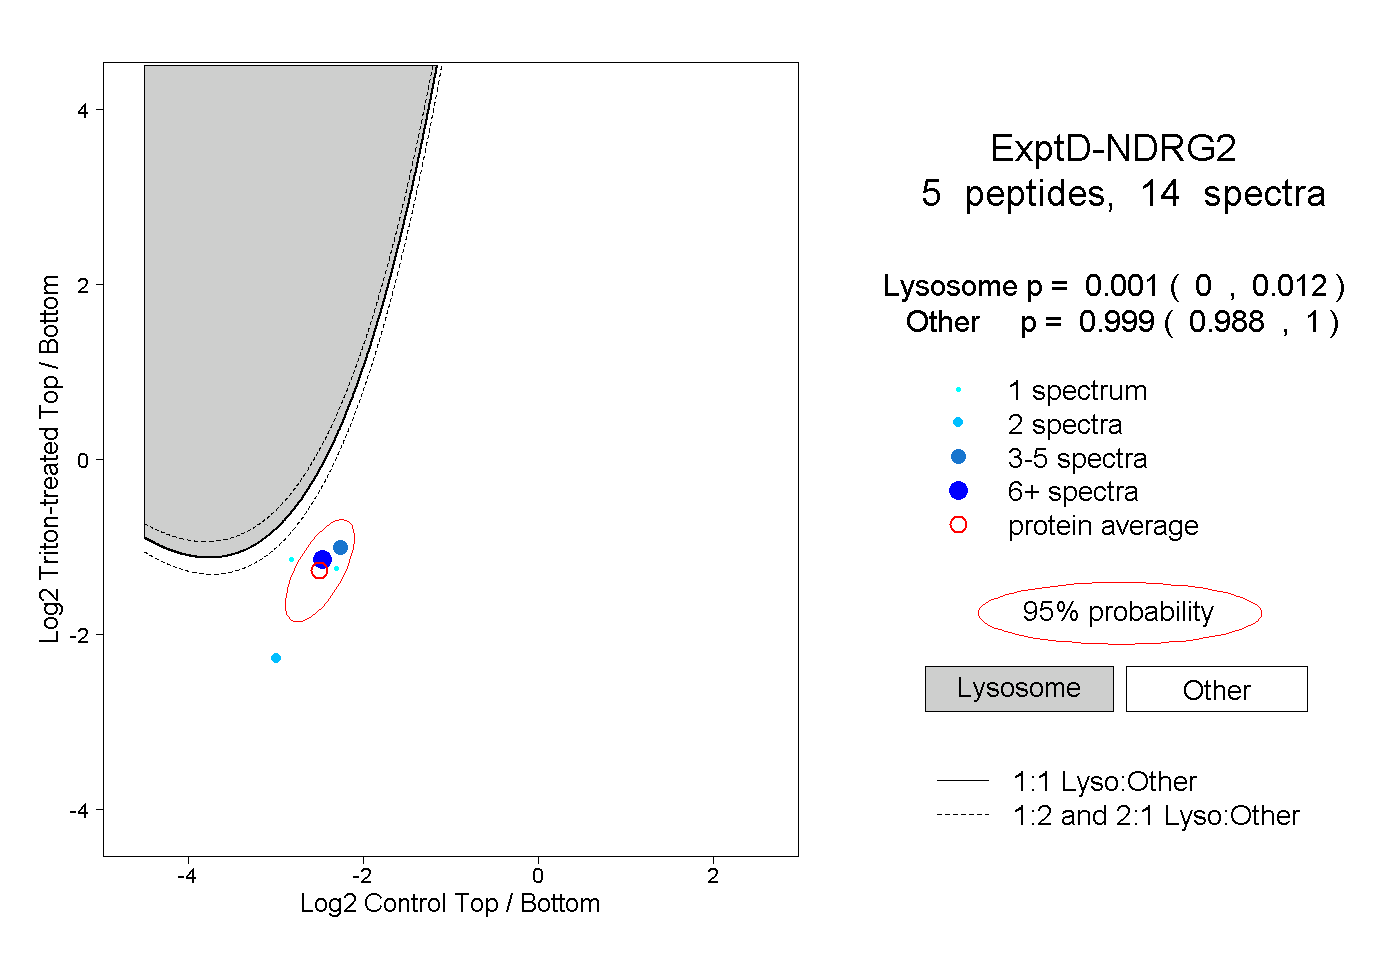 |
0.001 0.000 | 0.012 |
0.999 0.988 | 1.000 |