 6
6peptides
spectra
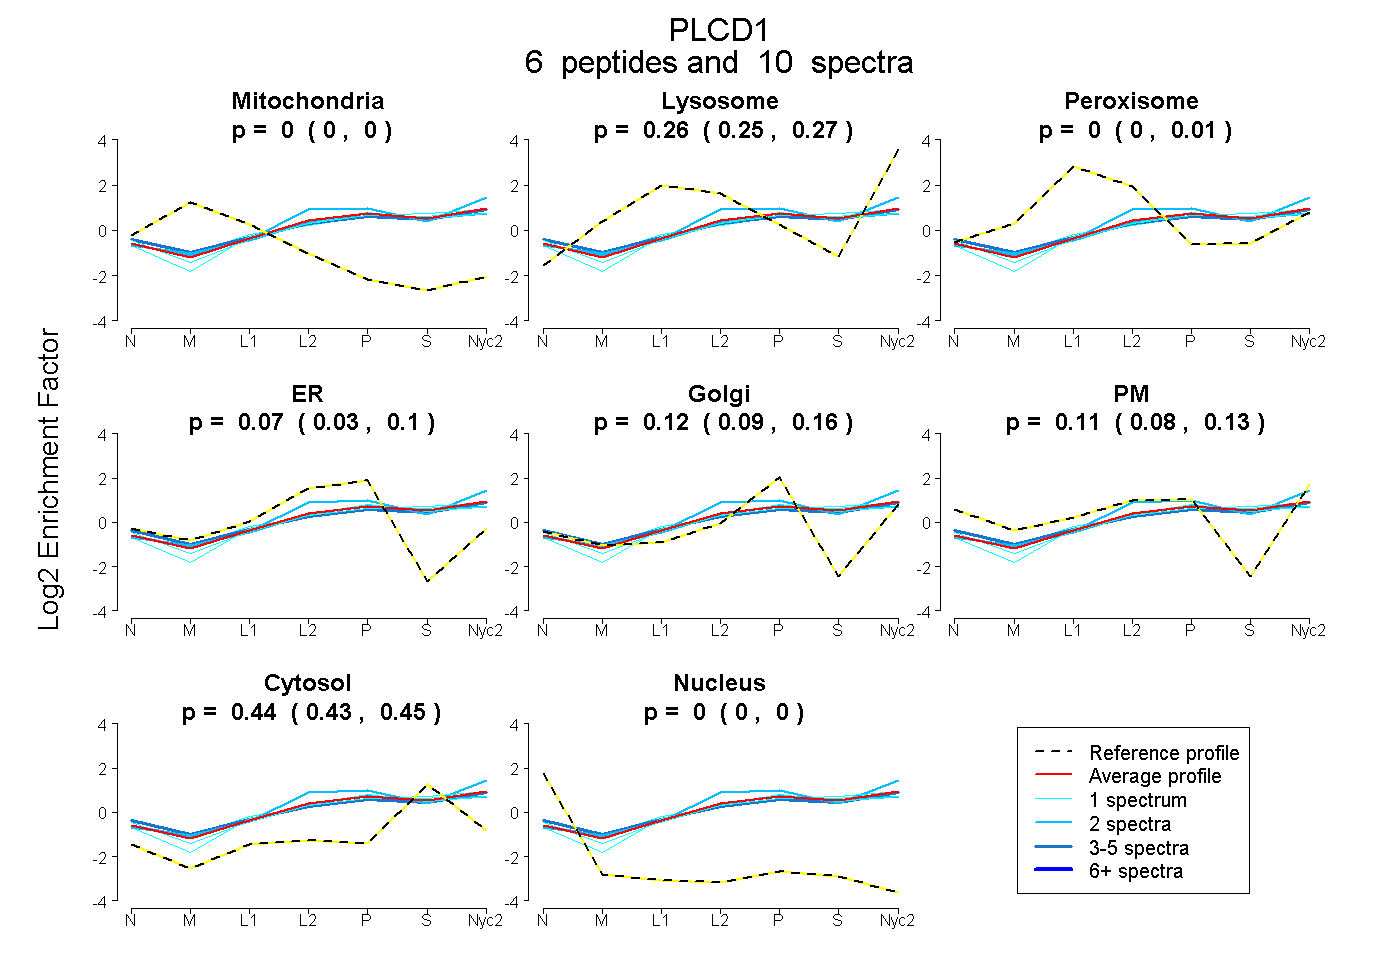
0.000 | 0.000
0.245 | 0.272
0.000 | 0.011
0.028 | 0.098
0.088 | 0.156
0.082 | 0.129
0.430 | 0.447
0.000 | 0.000
2peptides
spectra
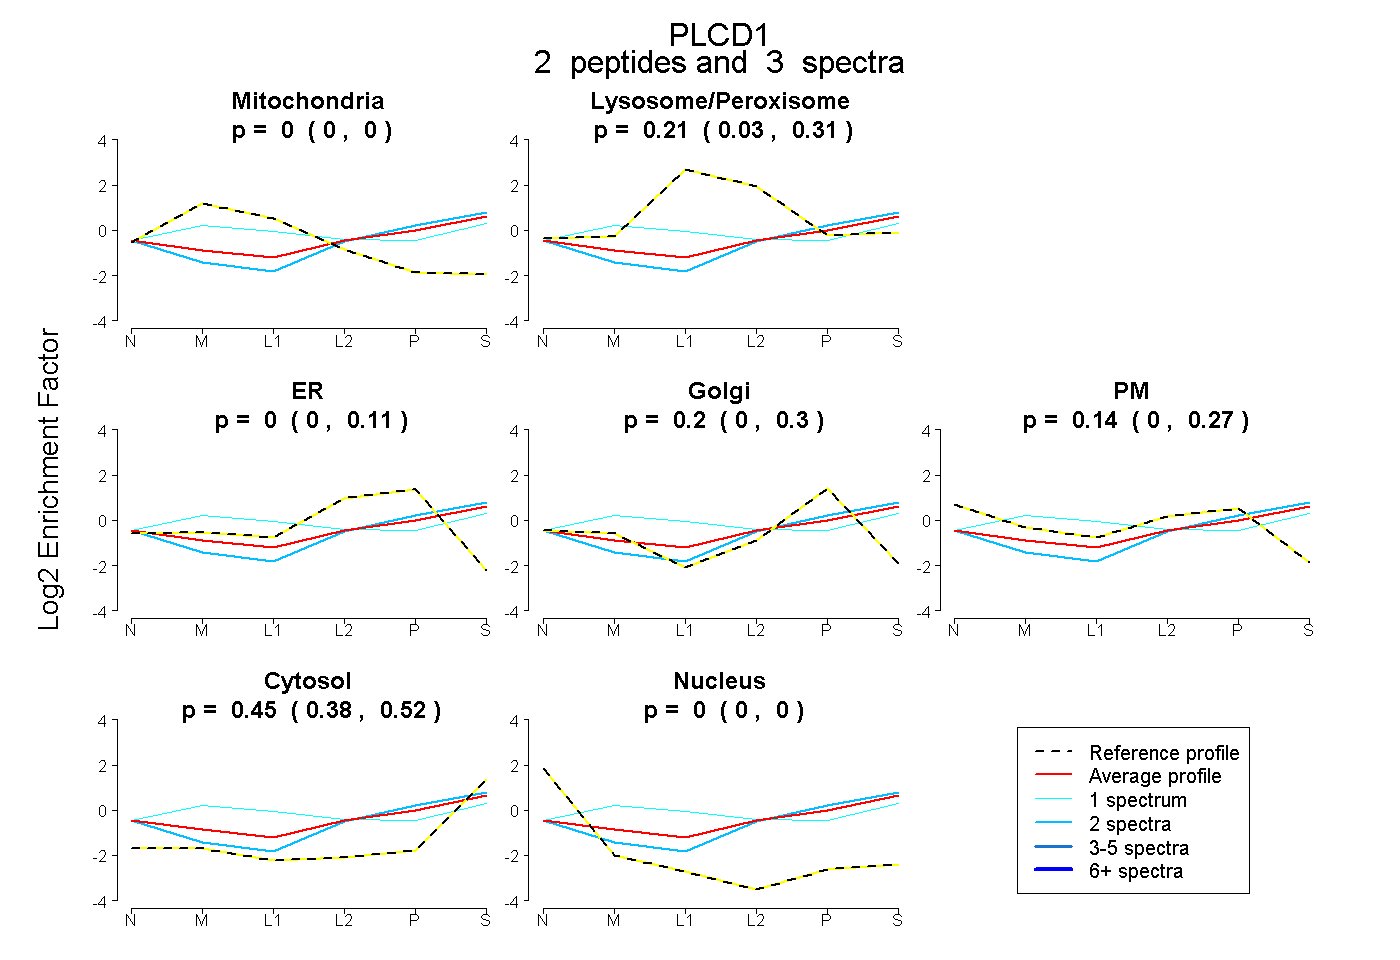
0.000 | 0.000
0.030 | 0.311
0.000 | 0.107
0.004 | 0.297
0.000 | 0.272
0.380 | 0.518
0.000 | 0.000
7peptides
spectra
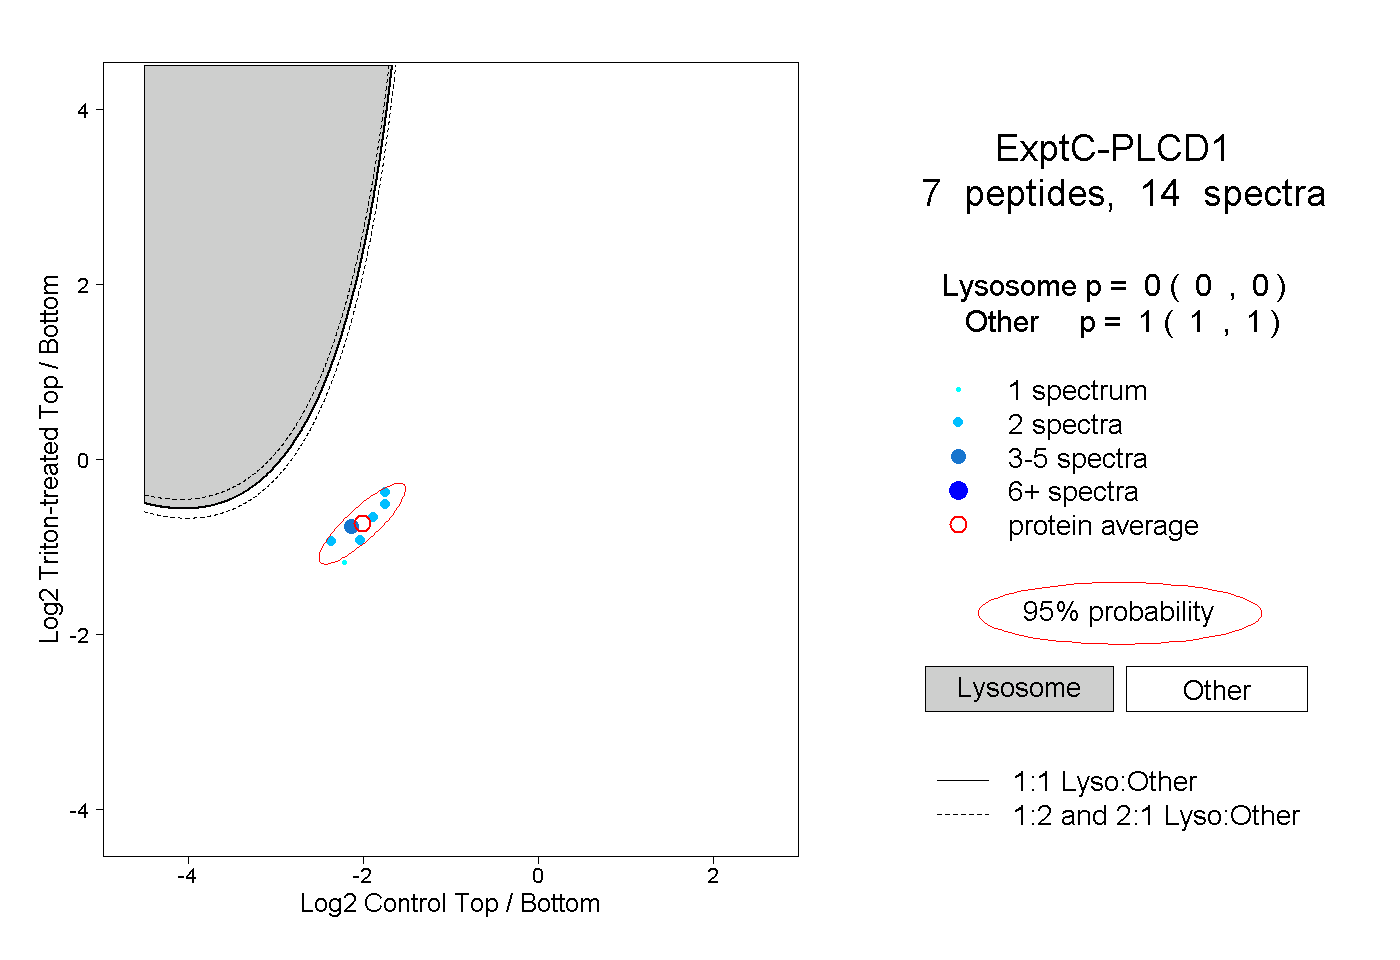
0.000 | 0.000
1.000 | 1.000