 6
6peptides
spectra
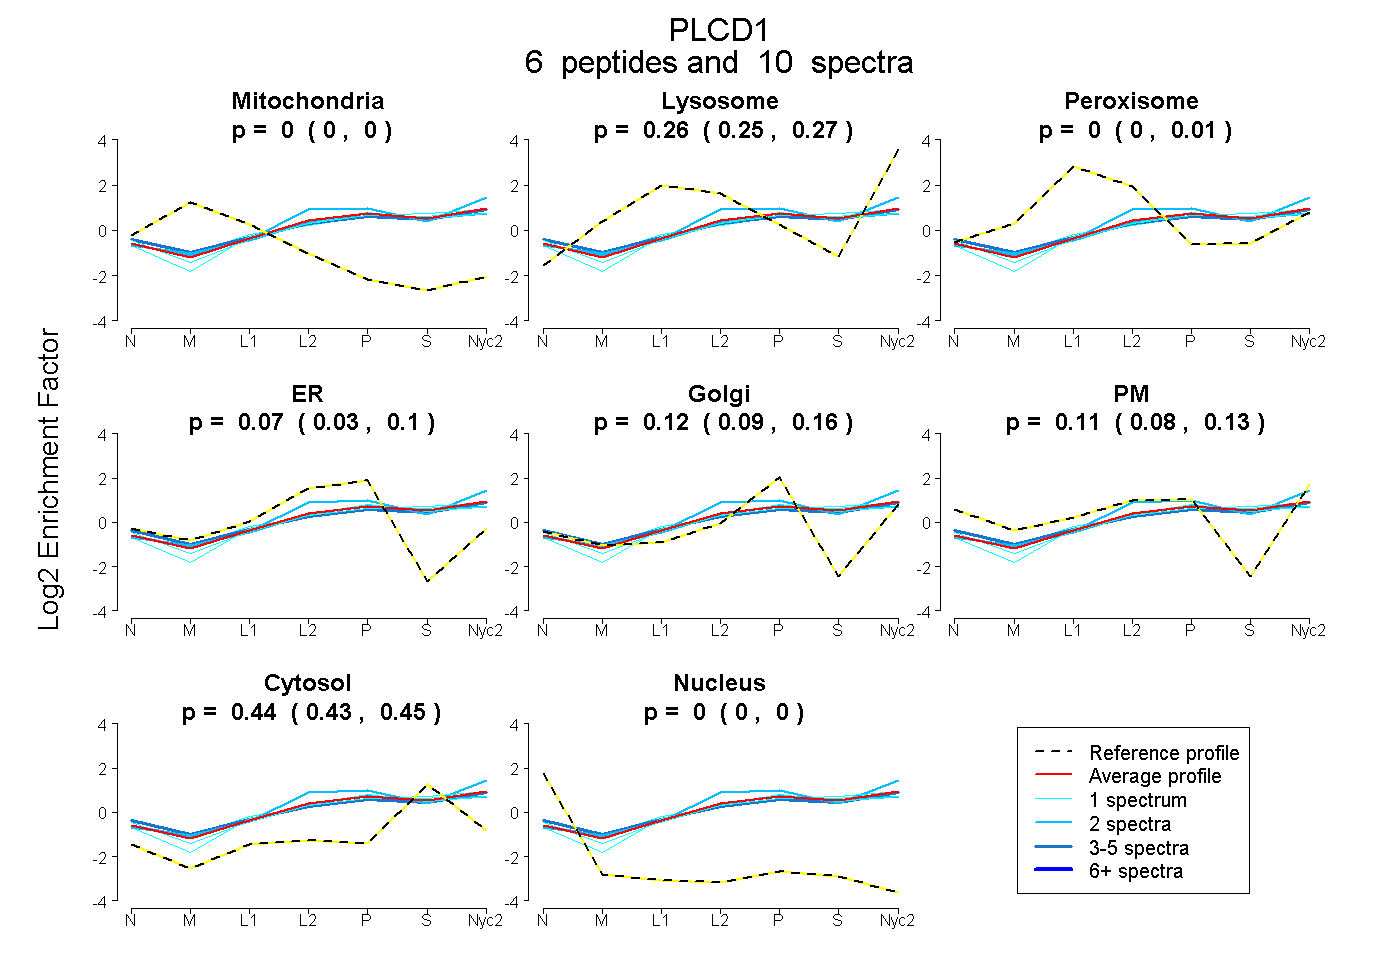
0.000 | 0.000
0.245 | 0.272
0.000 | 0.011
0.028 | 0.098
0.088 | 0.156
0.082 | 0.129
0.430 | 0.447
0.000 | 0.000
| Plot | Mito | Lyso | Perox | ER | Golgi | PM | Cytosol | Nucleus | |||||
| Expt A |
6 peptides |
10 spectra |
|
0.000 0.000 | 0.000 |
0.261 0.245 | 0.272 |
0.000 0.000 | 0.011 |
0.071 0.028 | 0.098 |
0.120 0.088 | 0.156 |
0.108 0.082 | 0.129 |
0.440 0.430 | 0.447 |
0.000 0.000 | 0.000 |
| 2 spectra, TIWQESR | 0.000 | 0.223 | 0.055 | 0.069 | 0.220 | 0.003 | 0.429 | 0.000 | ||
| 1 spectrum, YEPSETAK | 0.000 | 0.181 | 0.019 | 0.084 | 0.140 | 0.125 | 0.452 | 0.000 | ||
| 1 spectrum, SPESQLFSIEDIQEVR | 0.000 | 0.263 | 0.000 | 0.066 | 0.129 | 0.040 | 0.502 | 0.000 | ||
| 2 spectra, LVTFLQHQQR | 0.000 | 0.337 | 0.000 | 0.056 | 0.182 | 0.079 | 0.346 | 0.000 | ||
| 3 spectra, IYPAGWR | 0.000 | 0.182 | 0.054 | 0.000 | 0.105 | 0.228 | 0.430 | 0.000 | ||
| 1 spectrum, AFEEAAGSAETLSVER | 0.000 | 0.251 | 0.086 | 0.000 | 0.228 | 0.002 | 0.432 | 0.000 |
| Plot | Mito | Lyso or Perox | ER | Golgi | PM | Cytosol | Nucleus | ||||||
| Expt B |
2 peptides |
3 spectra |
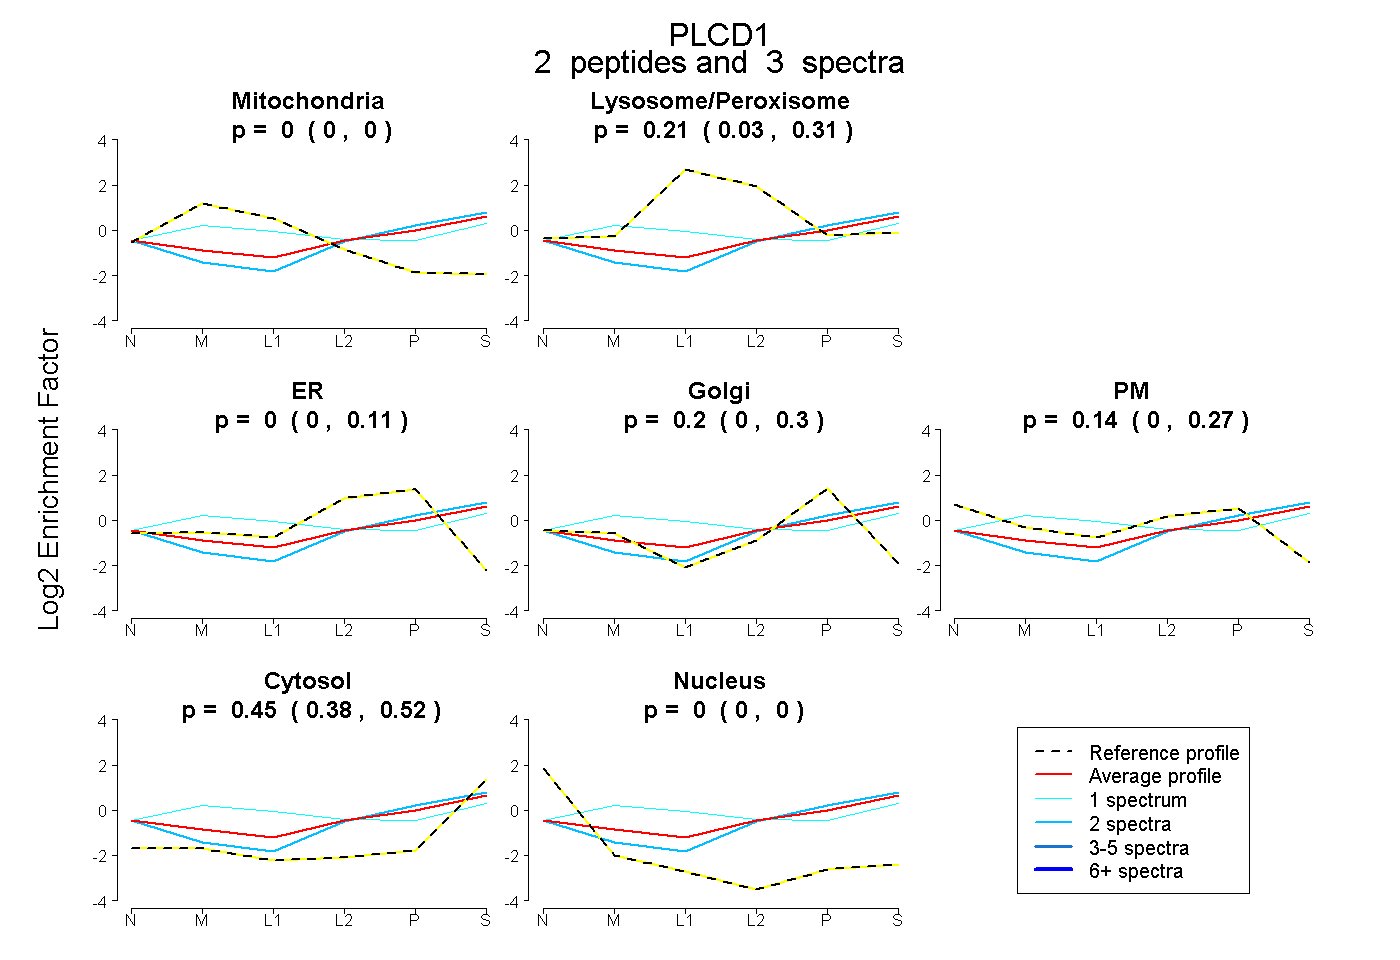 |
0.000 0.000 | 0.000 |
0.210 0.030 | 0.311 |
0.000 0.000 | 0.107 |
0.201 0.004 | 0.297 |
0.142 0.000 | 0.272 |
0.447 0.380 | 0.518 |
0.000 0.000 | 0.000 |
|||
| Plot | Lyso | Other | |||||||||||
| Expt C |
7 peptides |
14 spectra |
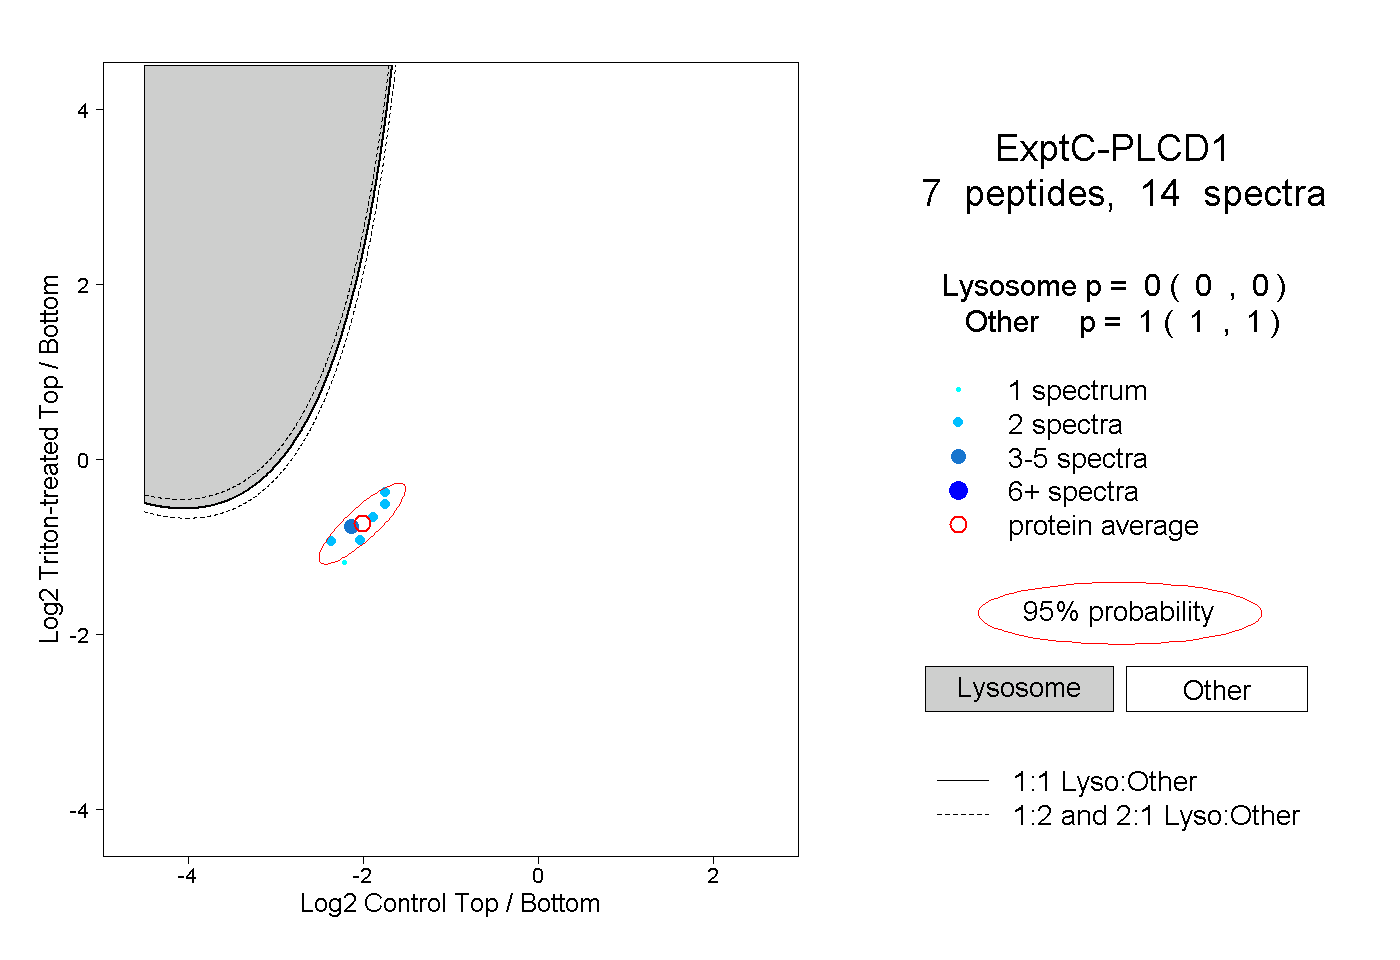 |
0.000 0.000 | 0.000 |
1.000 1.000 | 1.000 |