 5
5peptides
spectra
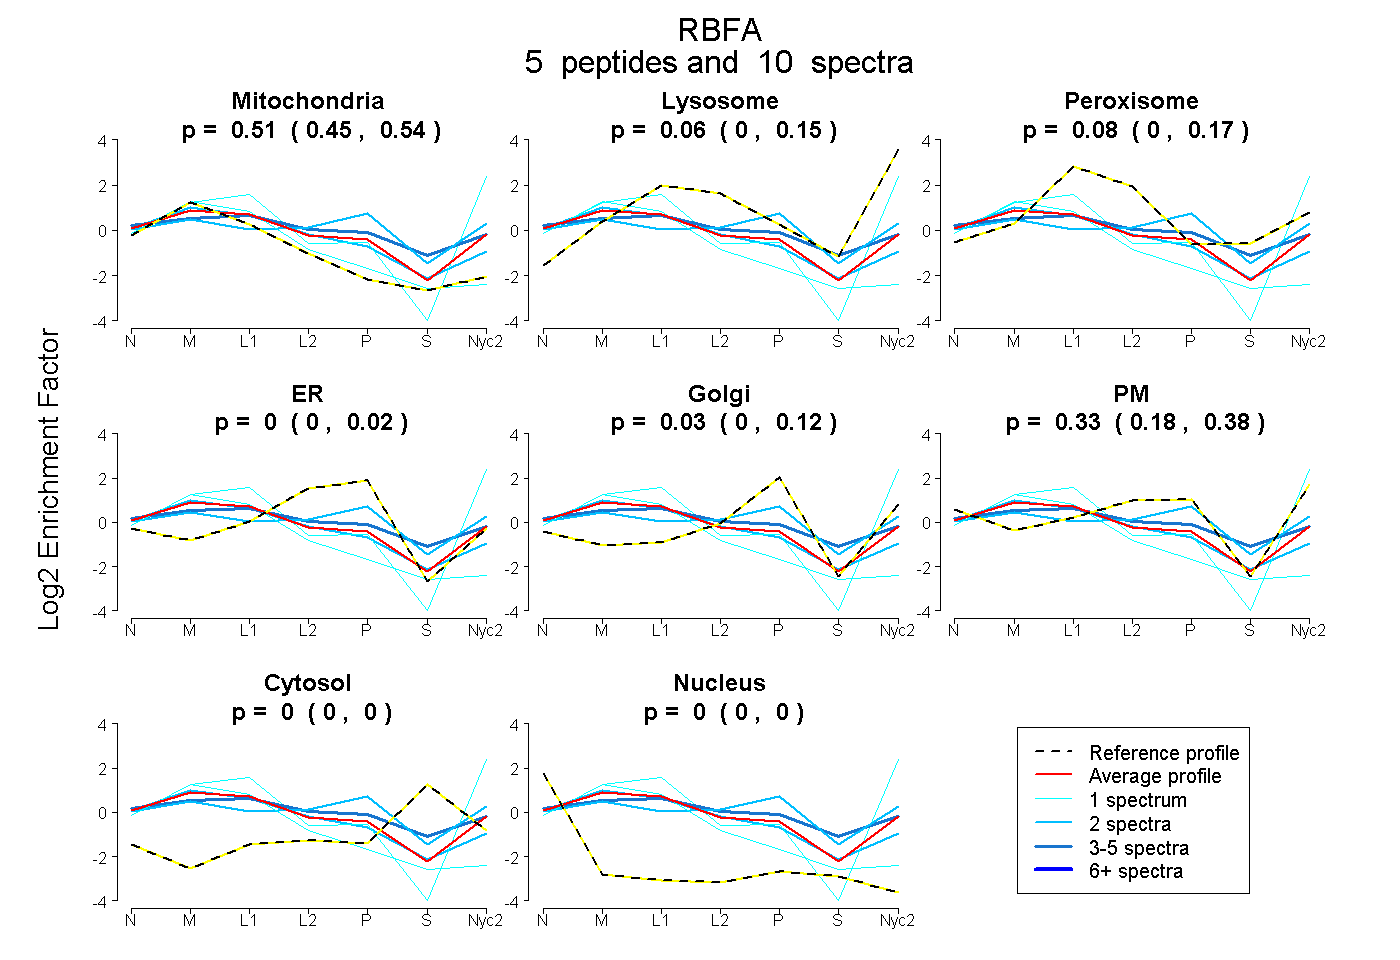
0.455 | 0.542
0.000 | 0.154
0.000 | 0.171
0.000 | 0.023
0.000 | 0.120
0.181 | 0.379
0.000 | 0.000
0.000 | 0.000
1peptide
spectra
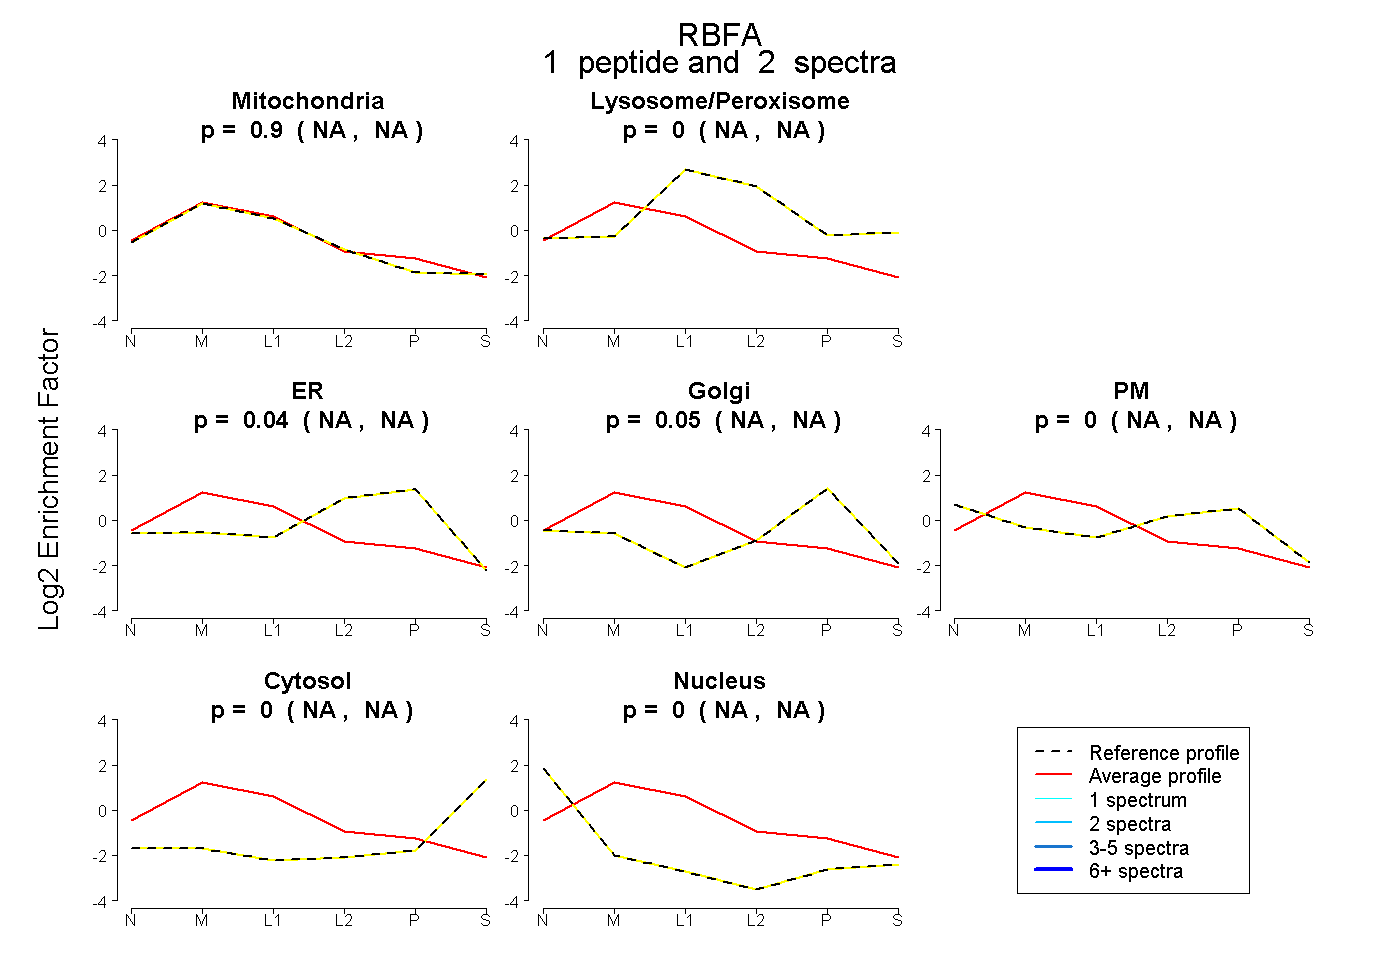
NA | NA
NA | NA
NA | NA
NA | NA
NA | NA
NA | NA
NA | NA
4peptides
spectra
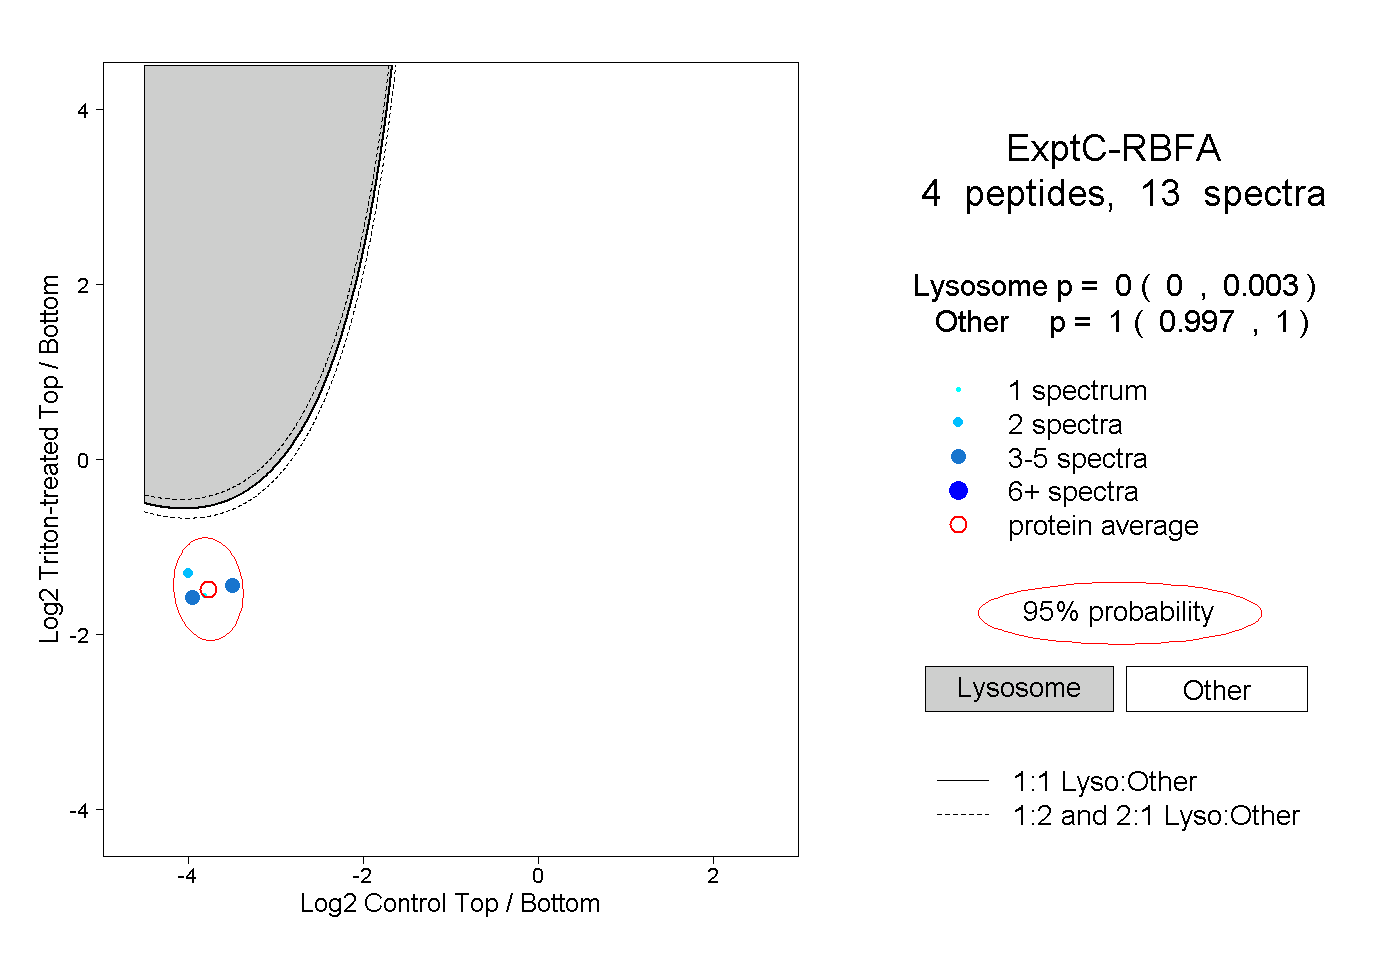
0.000 | 0.003
0.997 | 1.000