 5
5peptides
spectra
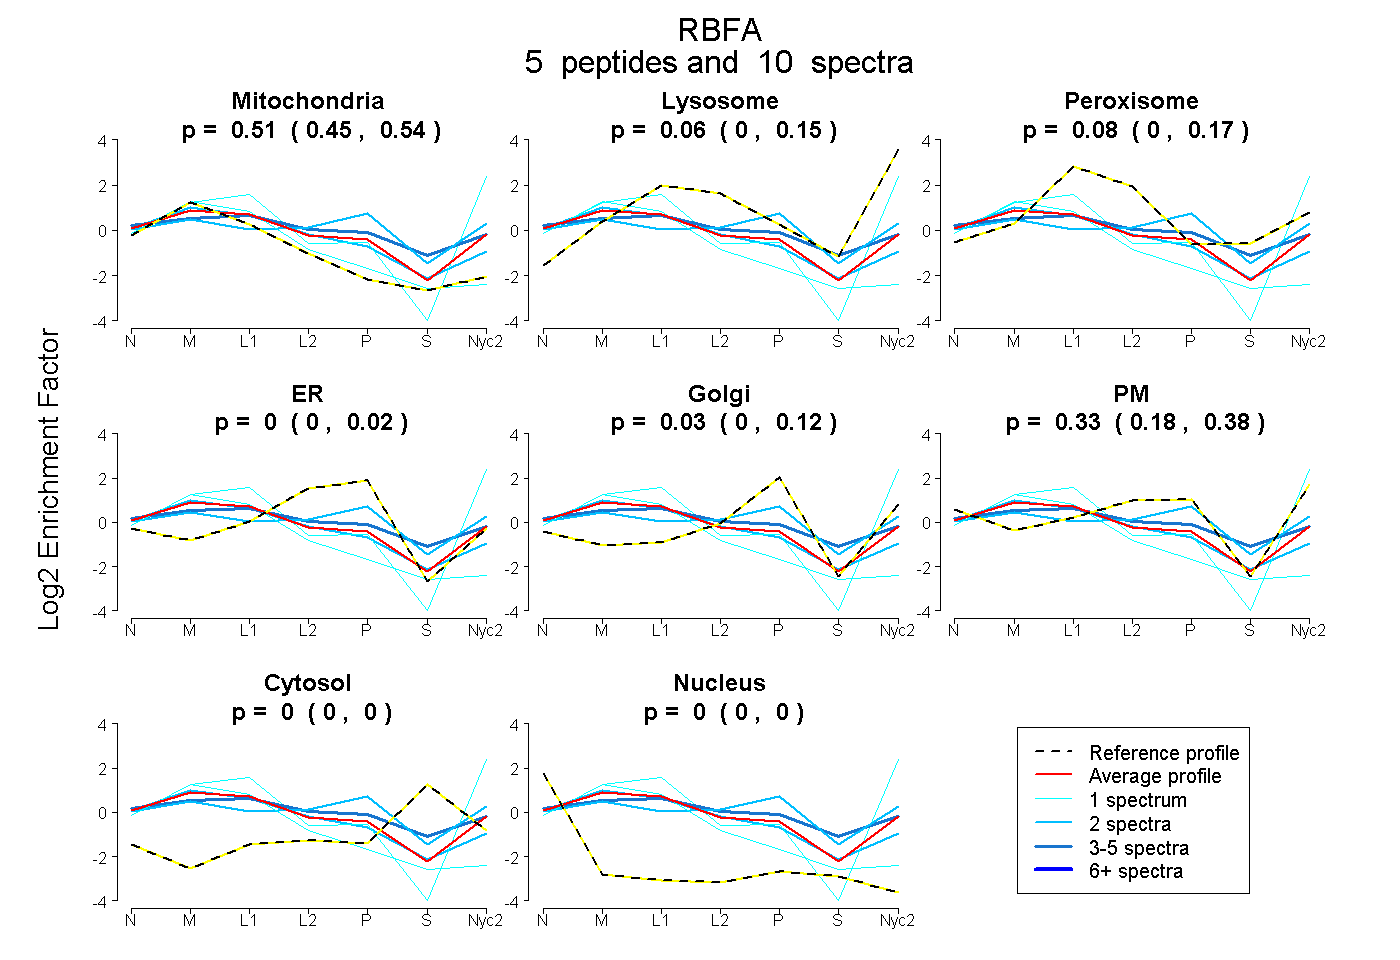
0.455 | 0.542
0.000 | 0.154
0.000 | 0.171
0.000 | 0.023
0.000 | 0.120
0.181 | 0.379
0.000 | 0.000
0.000 | 0.000
| Plot | Mito | Lyso | Perox | ER | Golgi | PM | Cytosol | Nucleus | |||||
| Expt A |
5 peptides |
10 spectra |
|
0.505 0.455 | 0.542 |
0.062 0.000 | 0.154 |
0.078 0.000 | 0.171 |
0.000 0.000 | 0.023 |
0.028 0.000 | 0.120 |
0.327 0.181 | 0.379 |
0.000 0.000 | 0.000 |
0.000 0.000 | 0.000 |
| 2 spectra, HTEAVLQR | 0.214 | 0.000 | 0.200 | 0.000 | 0.412 | 0.153 | 0.021 | 0.000 | ||
| 1 spectrum, GLQCVSLAPPSGQEQAPDPAHLLR | 0.328 | 0.389 | 0.000 | 0.000 | 0.000 | 0.283 | 0.000 | 0.000 | ||
| 4 spectra, HLLISQQTLR | 0.312 | 0.000 | 0.277 | 0.000 | 0.126 | 0.196 | 0.089 | 0.000 | ||
| 1 spectrum, VSVTPDFSACR | 0.926 | 0.000 | 0.038 | 0.036 | 0.000 | 0.000 | 0.000 | 0.000 | ||
| 2 spectra, DIVLAEVDR | 0.597 | 0.000 | 0.141 | 0.078 | 0.022 | 0.163 | 0.000 | 0.000 |
| Plot | Mito | Lyso or Perox | ER | Golgi | PM | Cytosol | Nucleus | ||||||
| Expt B |
1 peptide |
2 spectra |
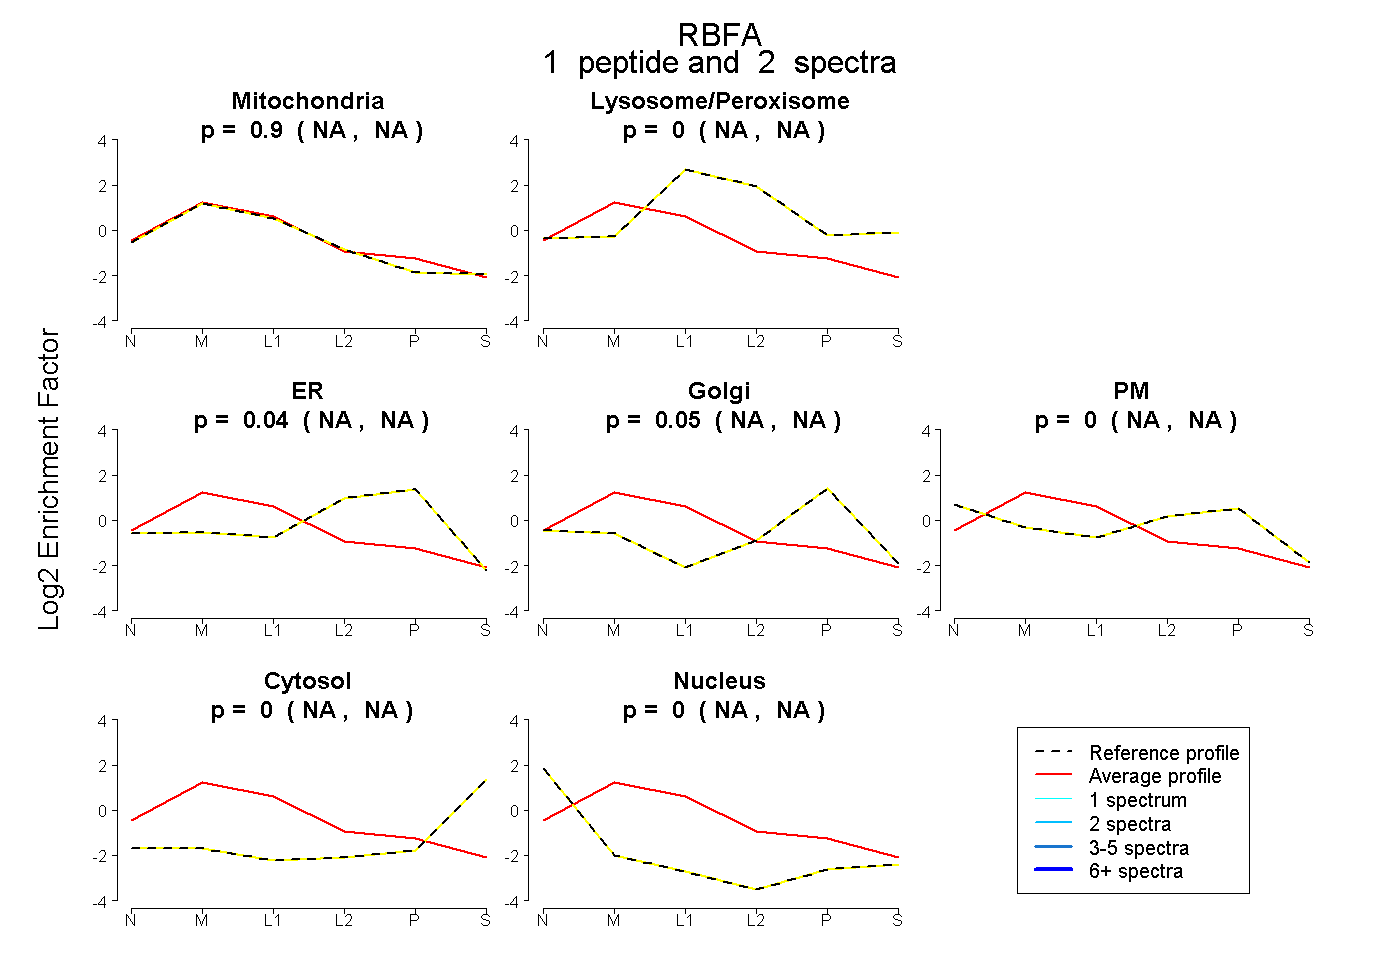 |
0.903 NA | NA |
0.000 NA | NA |
0.044 NA | NA |
0.053 NA | NA |
0.000 NA | NA |
0.000 NA | NA |
0.000 NA | NA |
|||
| Plot | Lyso | Other | |||||||||||
| Expt C |
4 peptides |
13 spectra |
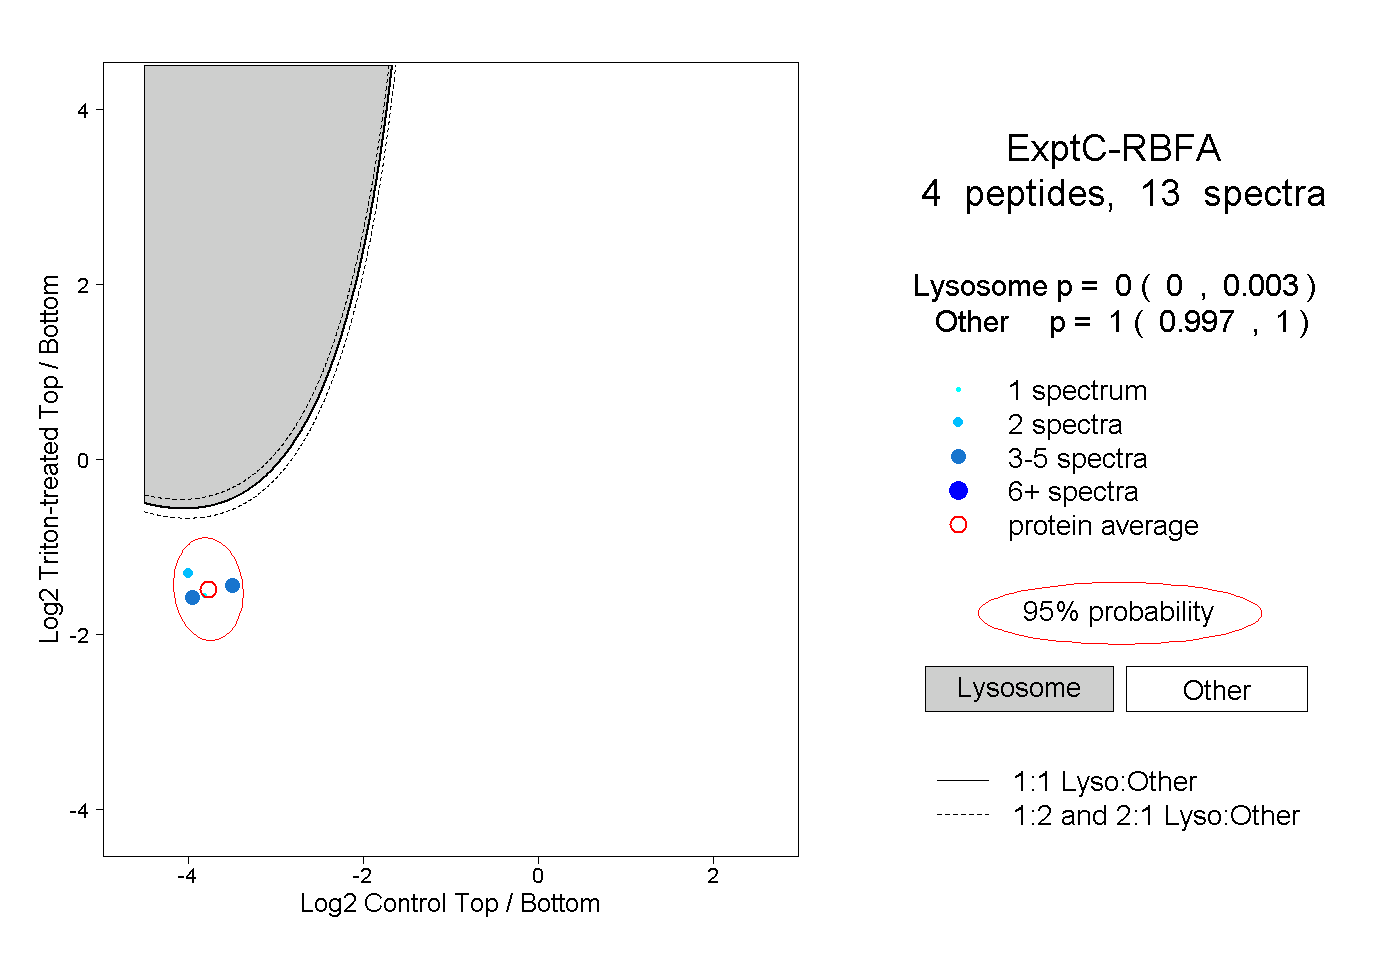 |
0.000 0.000 | 0.003 |
1.000 0.997 | 1.000 |