 7
7peptides
spectra
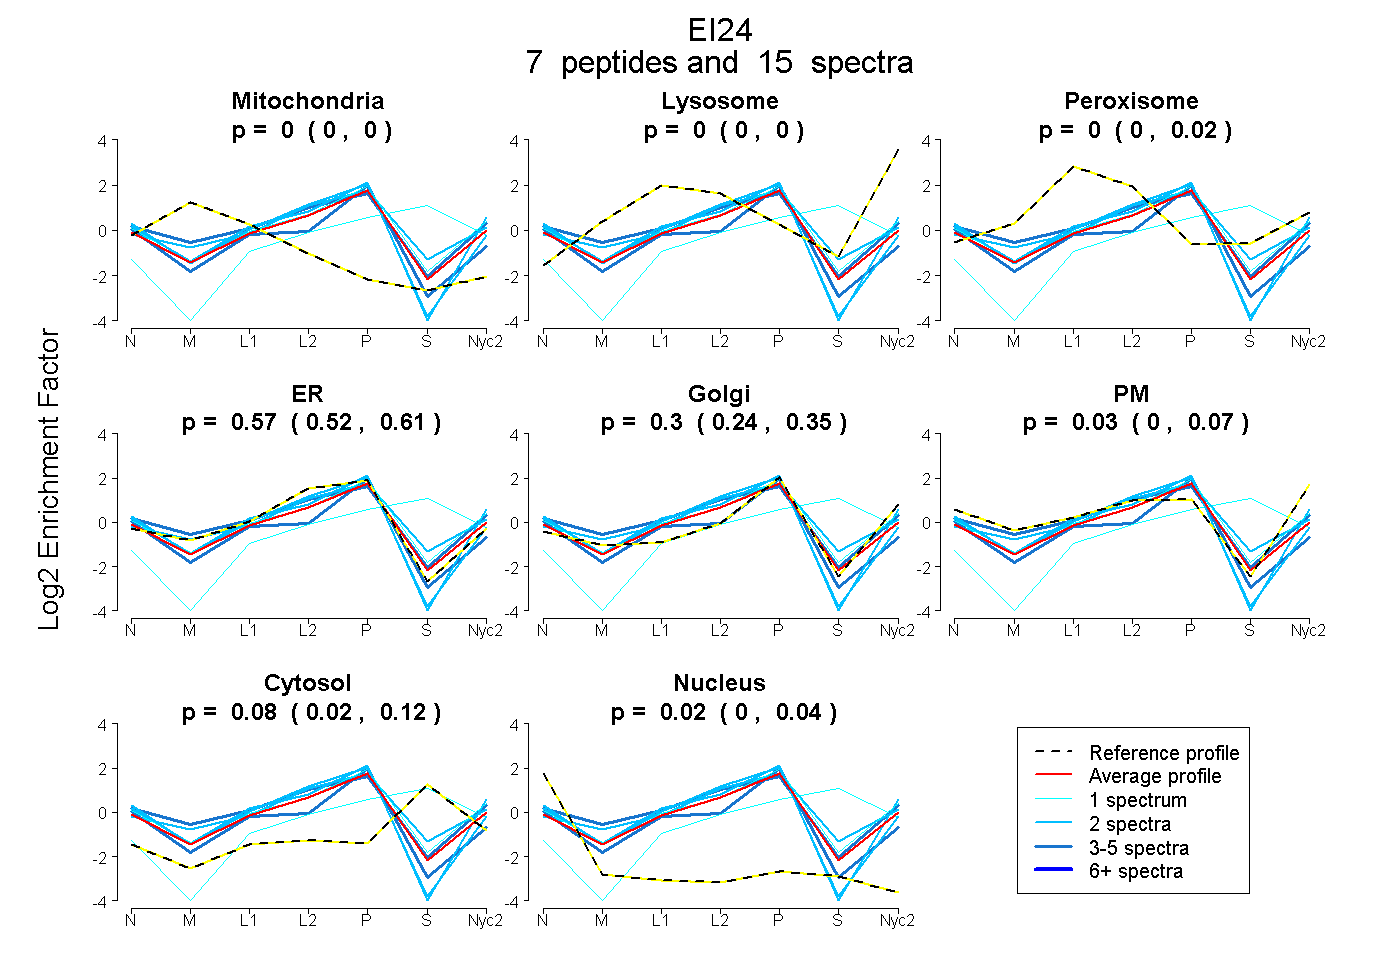
0.000 | 0.000
0.000 | 0.000
0.000 | 0.019
0.519 | 0.611
0.237 | 0.350
0.000 | 0.075
0.016 | 0.124
0.000 | 0.044
2peptides
spectra
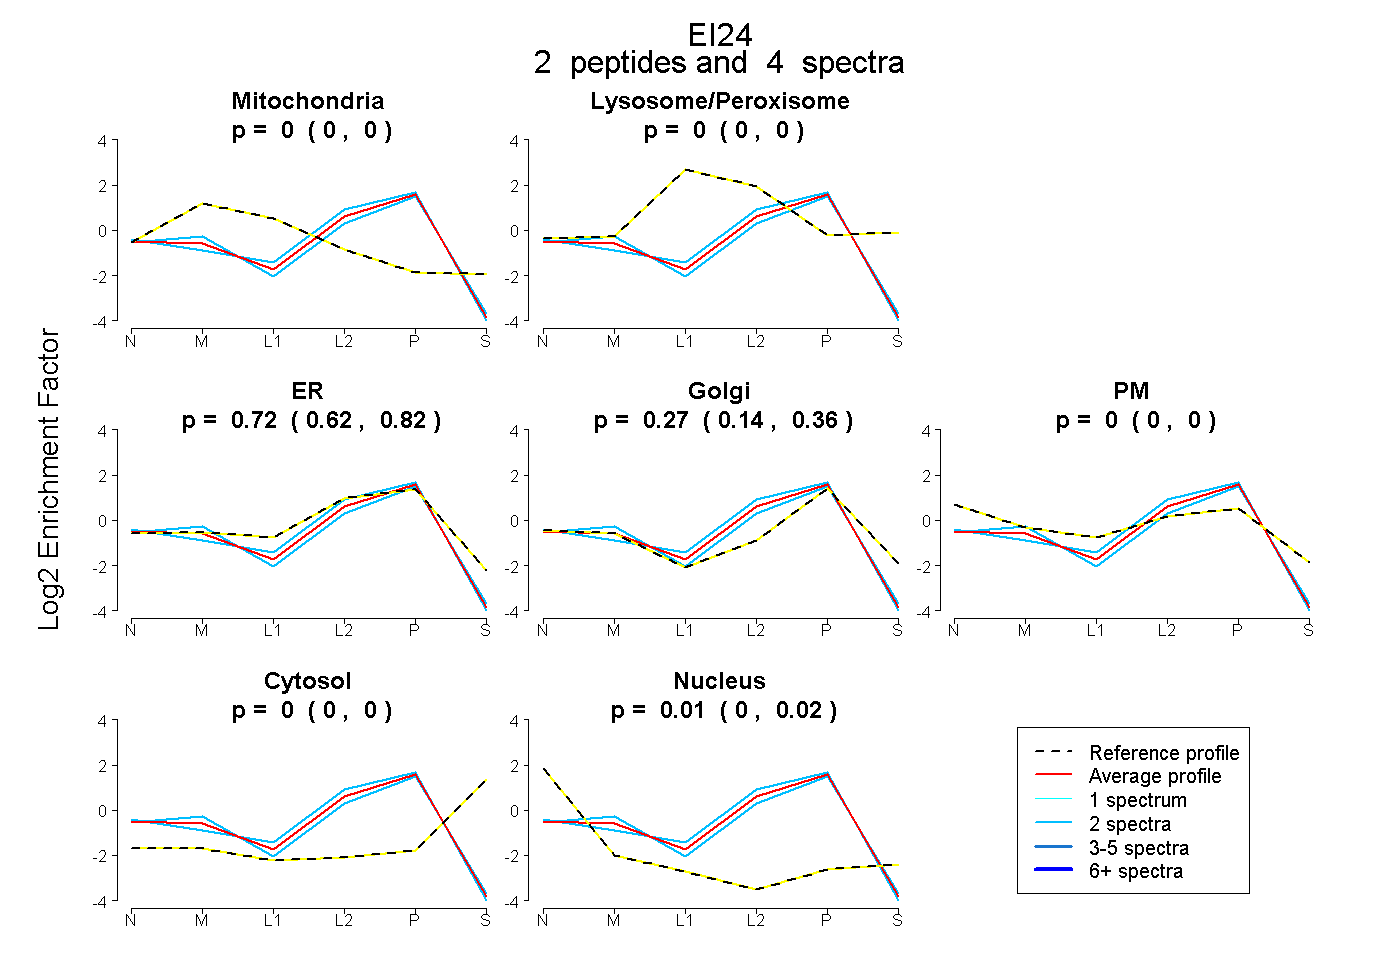
0.000 | 0.000
0.000 | 0.000
0.622 | 0.816
0.144 | 0.365
0.000 | 0.000
0.000 | 0.000
0.000 | 0.025
5peptides
spectra
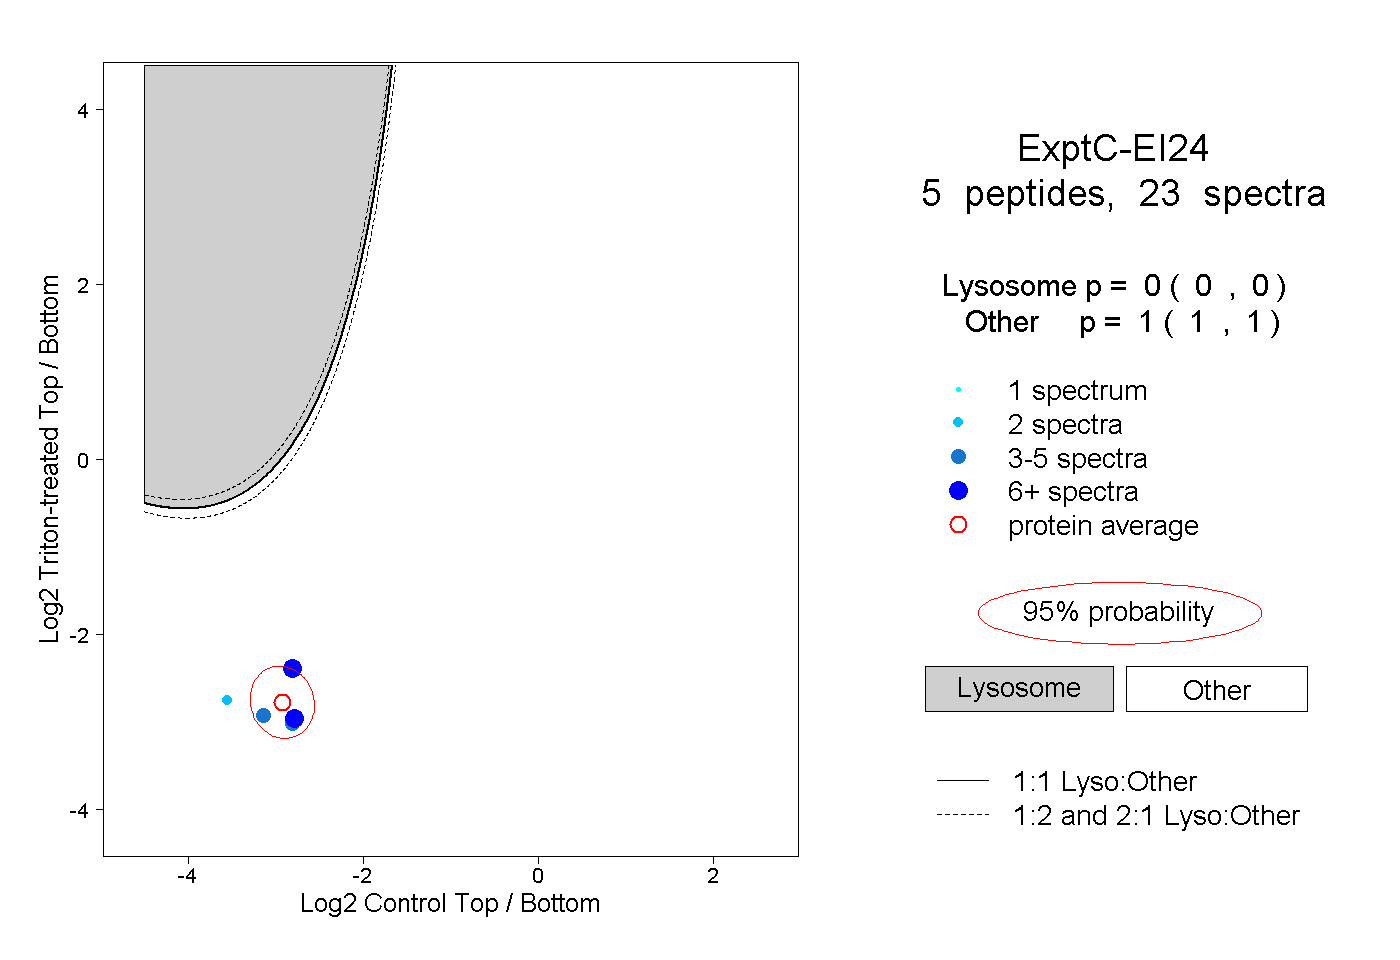
0.000 | 0.000
1.000 | 1.000