 7
7peptides
spectra
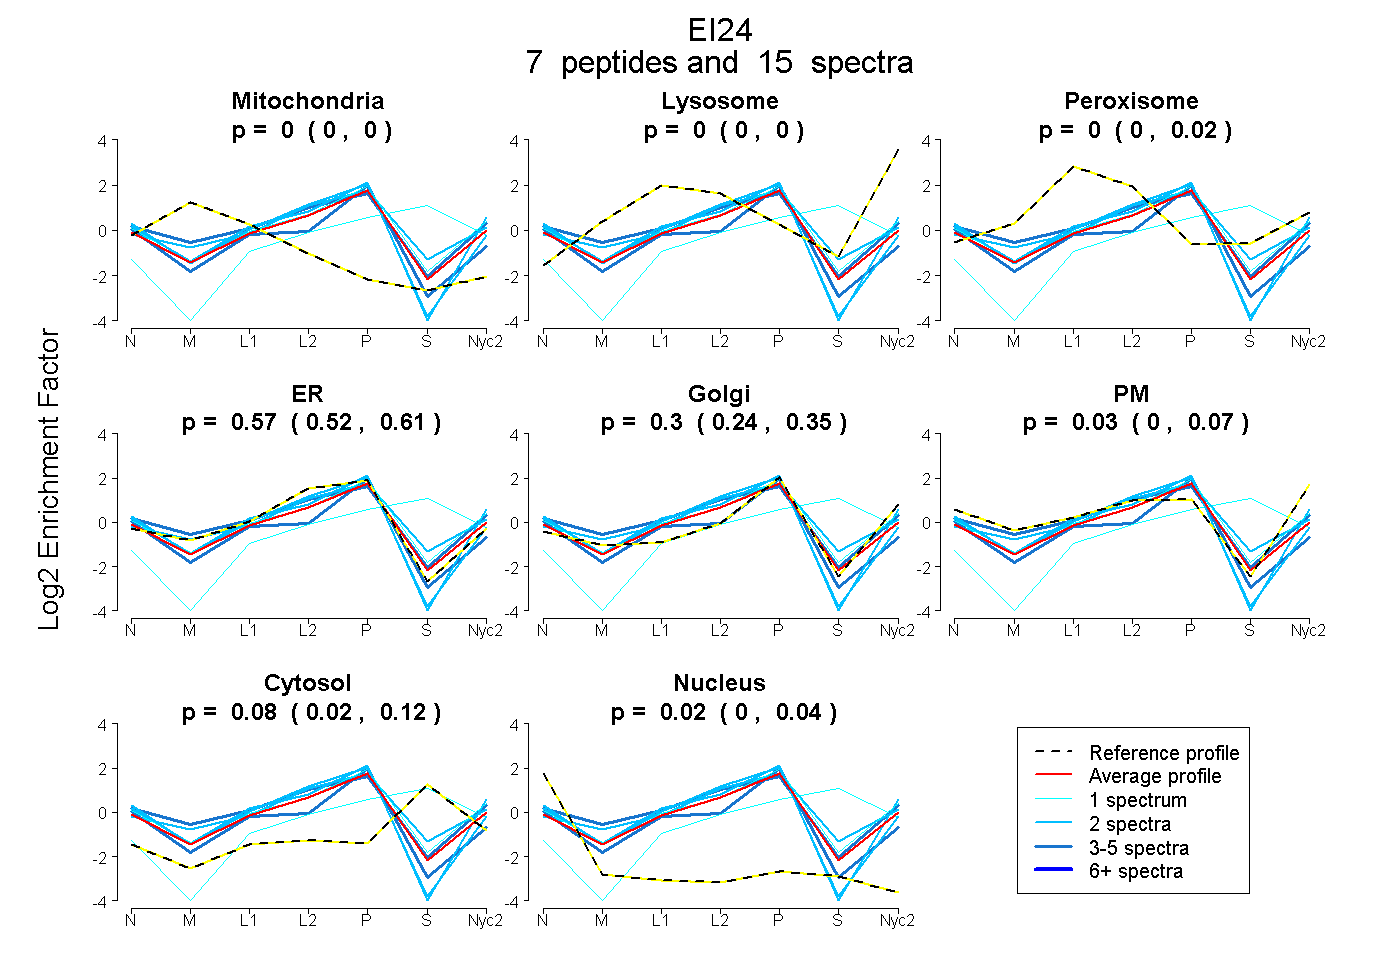
0.000 | 0.000
0.000 | 0.000
0.000 | 0.019
0.519 | 0.611
0.237 | 0.350
0.000 | 0.075
0.016 | 0.124
0.000 | 0.044
| Plot | Mito | Lyso | Perox | ER | Golgi | PM | Cytosol | Nucleus | |||||
| Expt A |
7 peptides |
15 spectra |
|
0.000 0.000 | 0.000 |
0.000 0.000 | 0.000 |
0.000 0.000 | 0.019 |
0.573 0.519 | 0.611 |
0.296 0.237 | 0.350 |
0.034 0.000 | 0.075 |
0.079 0.016 | 0.124 |
0.019 0.000 | 0.044 |
| 2 spectra, VFIPVLQSVTAR | 0.000 | 0.000 | 0.000 | 0.895 | 0.028 | 0.026 | 0.000 | 0.051 | ||
| 2 spectra, GIEMHQR | 0.000 | 0.000 | 0.118 | 0.520 | 0.254 | 0.002 | 0.106 | 0.000 | ||
| 1 spectrum, DSIWGICTISK | 0.000 | 0.000 | 0.000 | 0.167 | 0.069 | 0.000 | 0.764 | 0.000 | ||
| 4 spectra, ASSLLAQR | 0.000 | 0.000 | 0.000 | 0.536 | 0.327 | 0.000 | 0.000 | 0.138 | ||
| 3 spectra, AQSVER | 0.000 | 0.000 | 0.052 | 0.513 | 0.105 | 0.287 | 0.040 | 0.003 | ||
| 1 spectrum, TFLQDLGR | 0.000 | 0.000 | 0.014 | 0.413 | 0.345 | 0.146 | 0.083 | 0.000 | ||
| 2 spectra, AYLFQLR | 0.000 | 0.000 | 0.000 | 0.552 | 0.265 | 0.183 | 0.000 | 0.000 |
| Plot | Mito | Lyso or Perox | ER | Golgi | PM | Cytosol | Nucleus | ||||||
| Expt B |
2 peptides |
4 spectra |
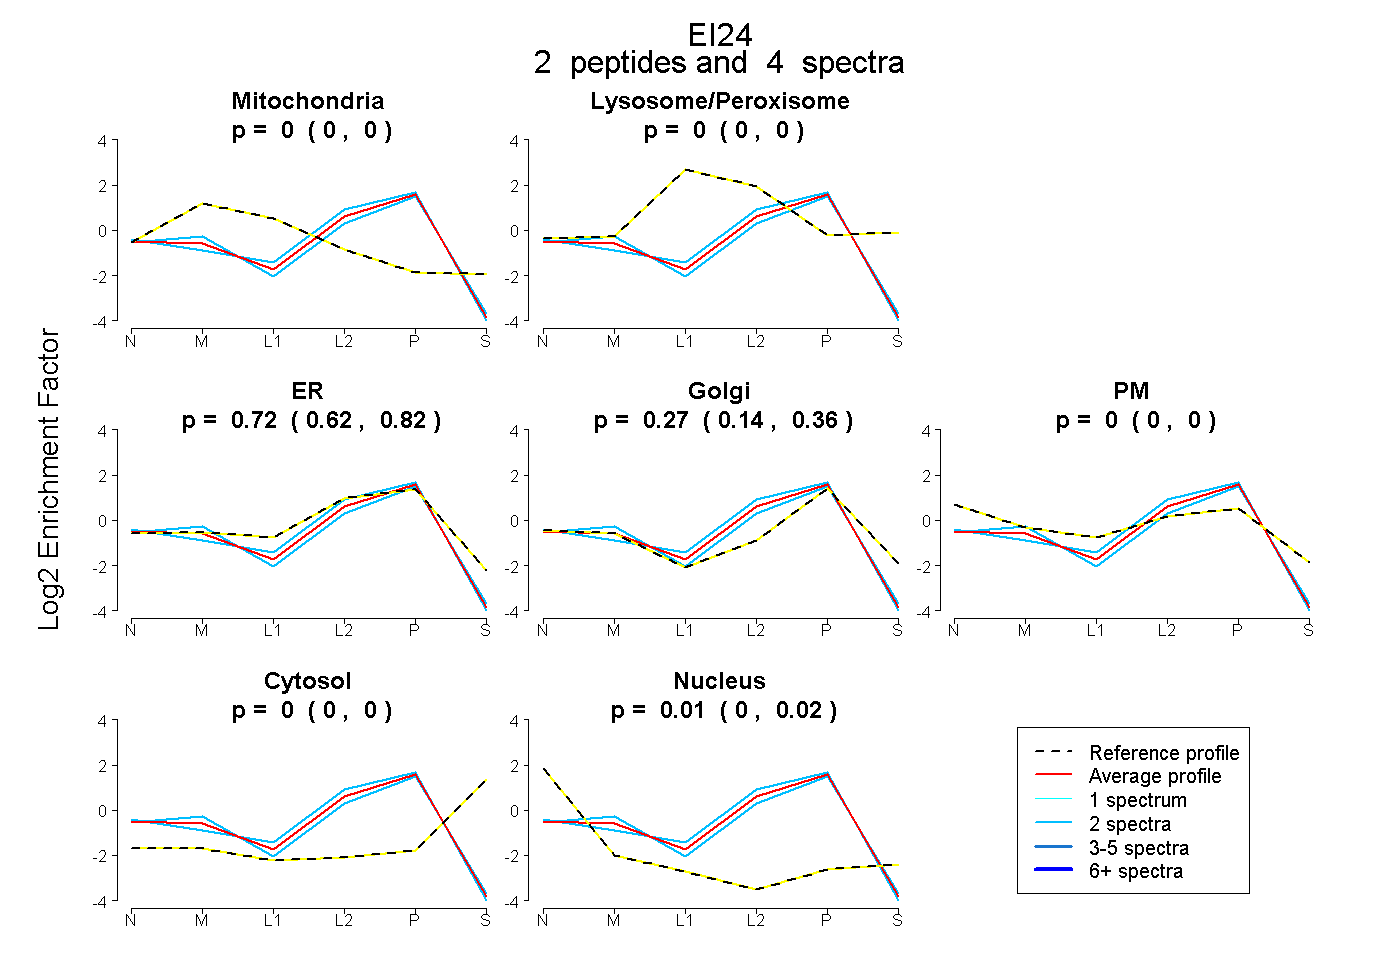 |
0.000 0.000 | 0.000 |
0.000 0.000 | 0.000 |
0.723 0.622 | 0.816 |
0.270 0.144 | 0.365 |
0.000 0.000 | 0.000 |
0.000 0.000 | 0.000 |
0.006 0.000 | 0.025 |
|||
| Plot | Lyso | Other | |||||||||||
| Expt C |
5 peptides |
23 spectra |
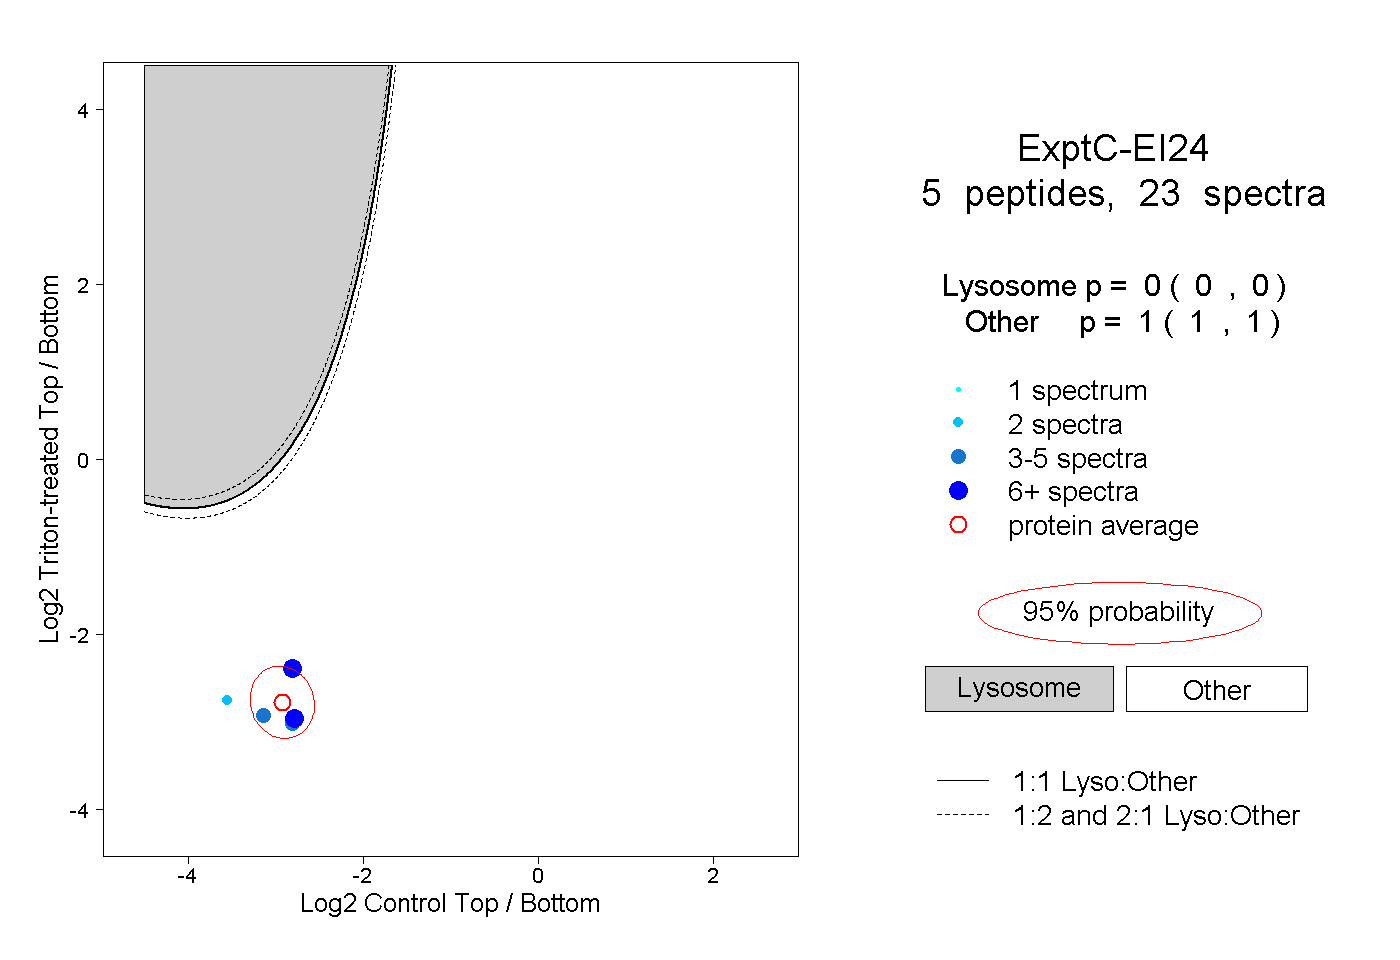 |
0.000 0.000 | 0.000 |
1.000 1.000 | 1.000 |