 2
2peptides
spectra
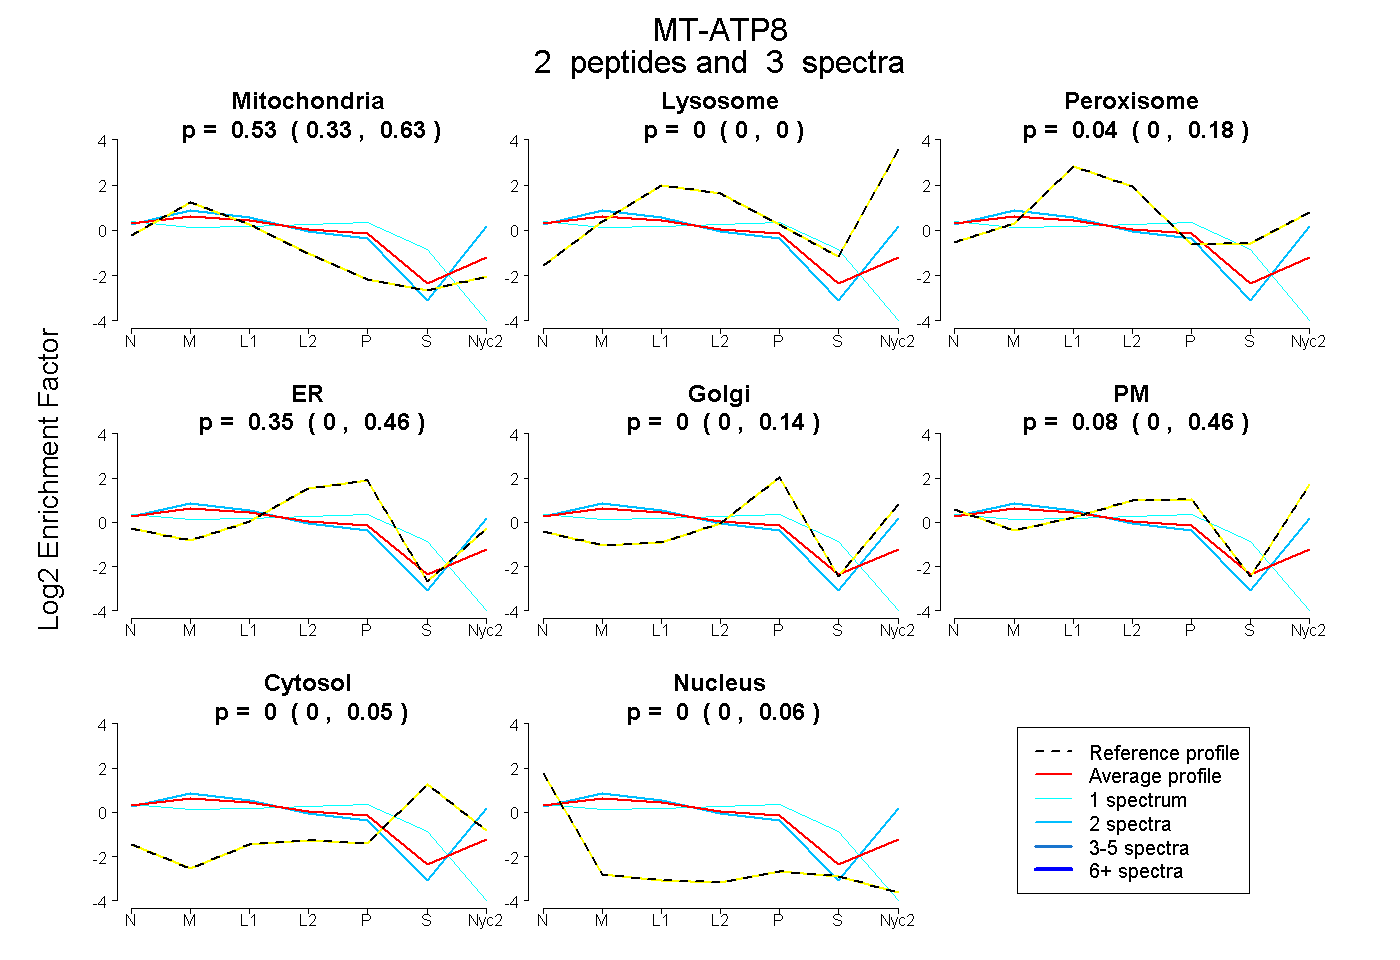
0.334 | 0.632
0.000 | 0.000
0.000 | 0.183
0.000 | 0.464
0.000 | 0.137
0.000 | 0.460
0.000 | 0.053
0.000 | 0.058
2peptides
spectra
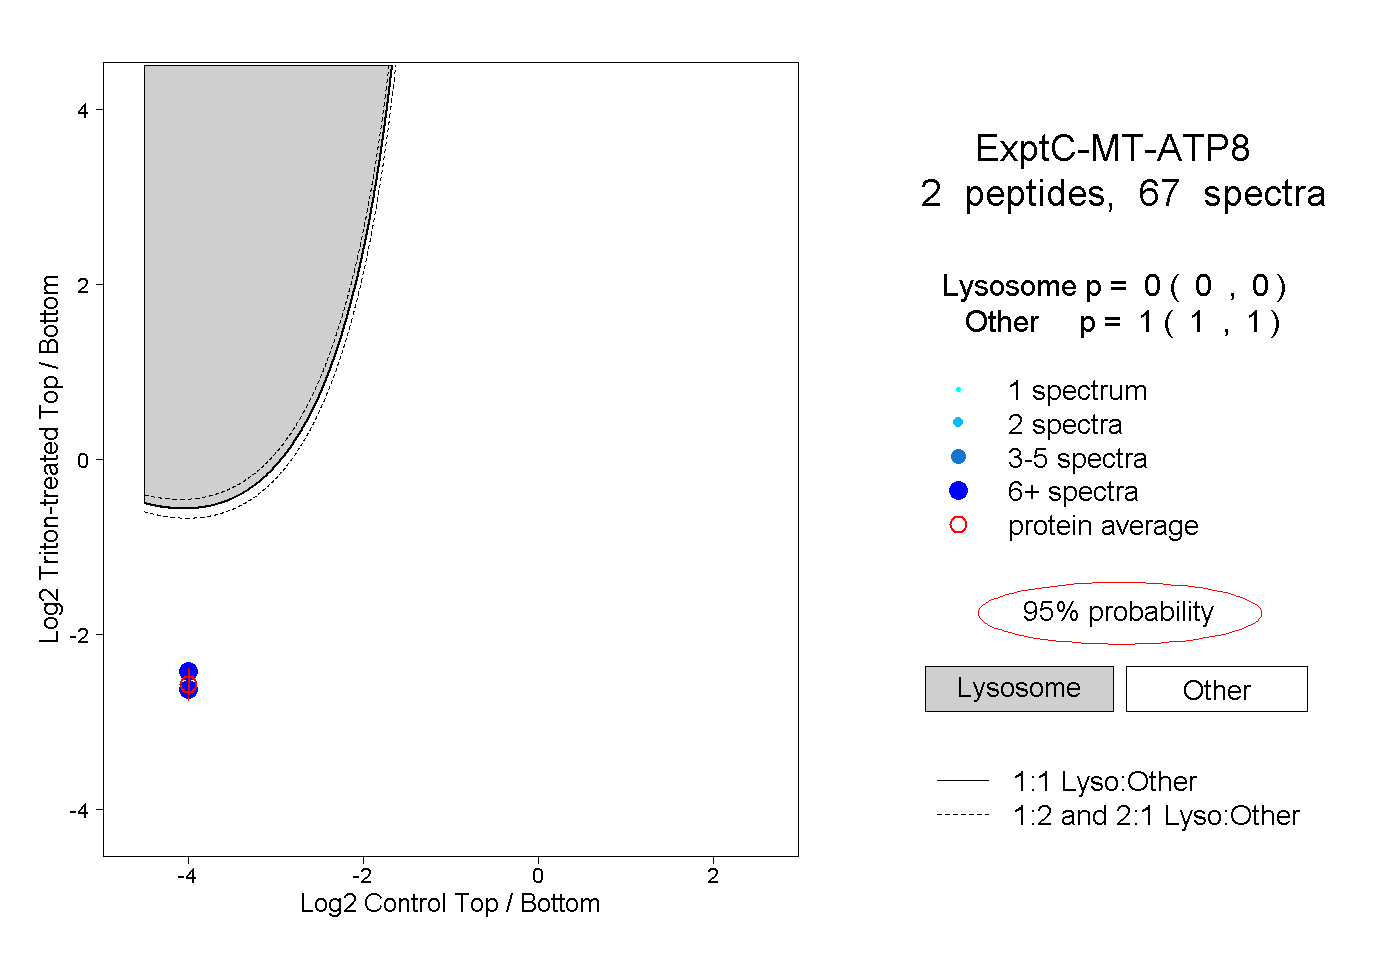
0.000 | 0.000
1.000 | 1.000
2peptides
spectra
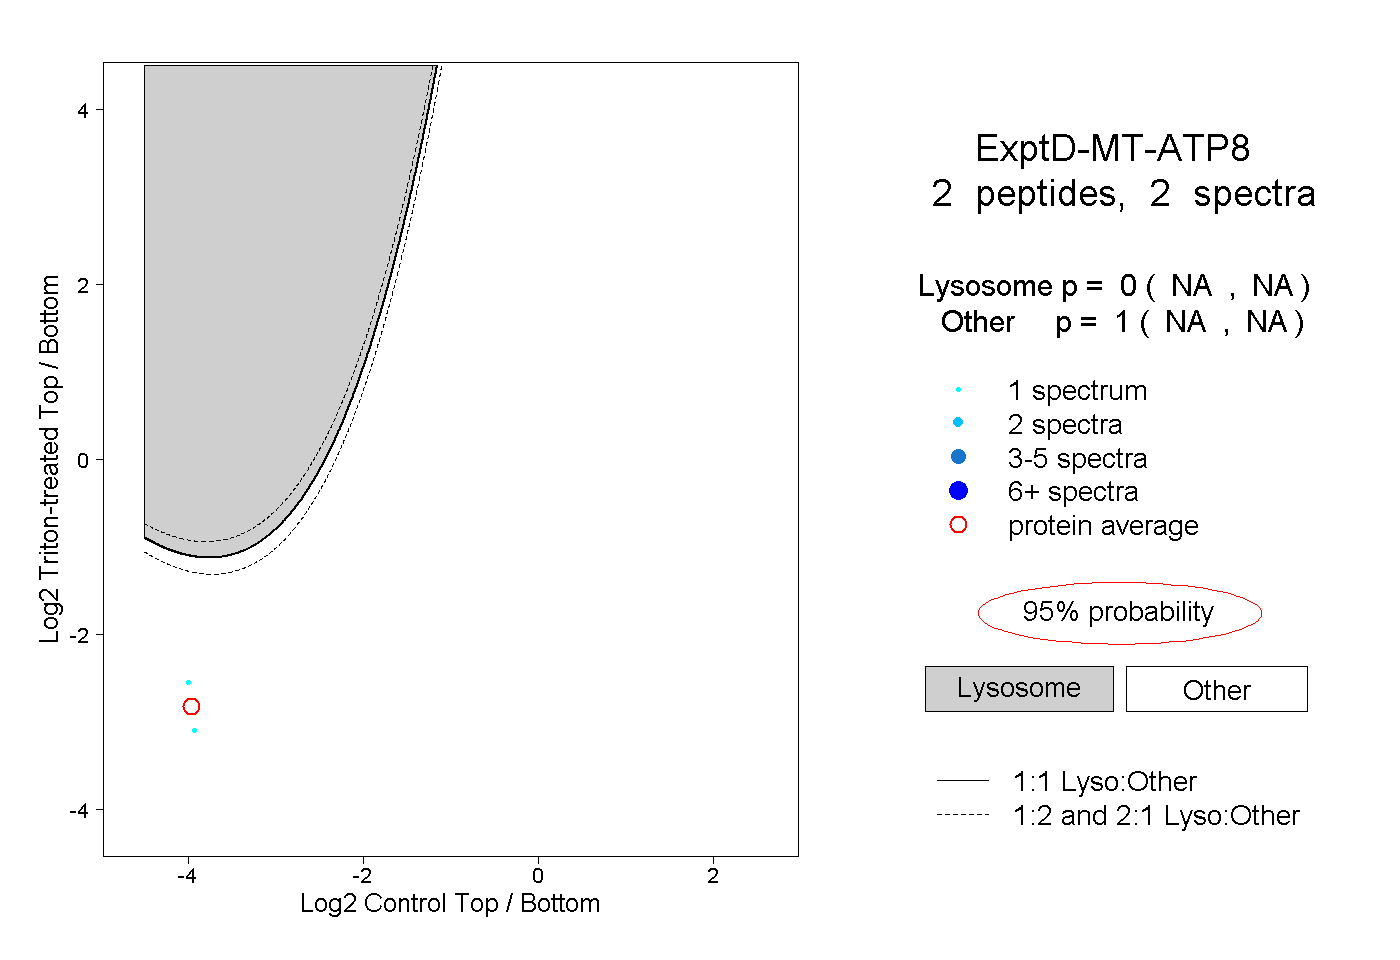
NA | NA
NA | NA